
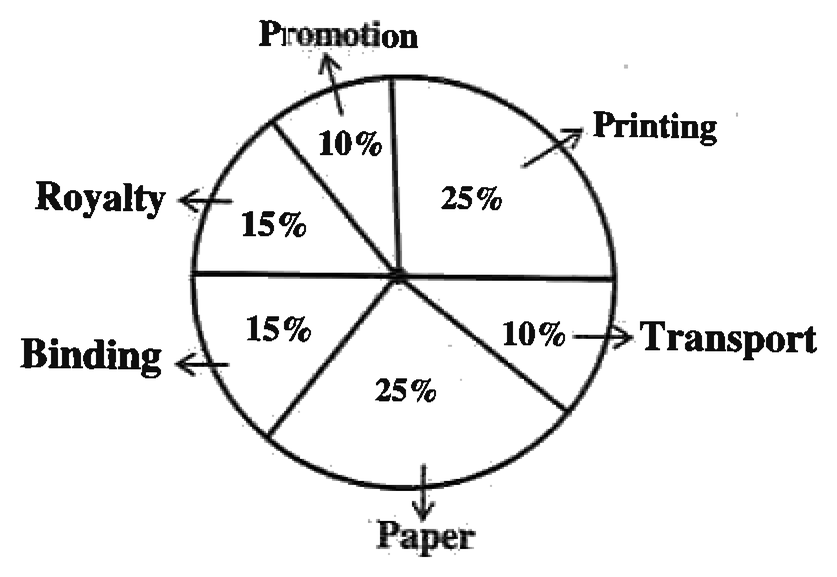
In the following pie chart, the percentage distribution of the expenditure incurred in publishing a book is given – If for a certain quantity of books, the publisher has to pay ₹ 22,950 for royalty, then what will be the amount of printing to be paid for the books?
- (1)₹ 46,250
- (2)₹ 36,250
- (3)₹ 38,250
- (4)₹ 42,250
Answer
Why
Correct — option (3), ₹ 38,250.
Step 1 — read the shares from the figure.
Printing 25%, Transport 10%, Paper 25%
Binding 15%, Royalty 15%, Promotion 10%
Check: 25 + 10 + 25 + 15 + 15 + 10 = 100%
Step 2 — find 1% of the expenditure from royalty.
Royalty 15% = ₹ 22,950
1% = 22,950 ÷ 15 = ₹ 1,530
Step 3 — scale up to printing.
Printing 25% = 25 × 1,530 = ₹ 38,250
Check by ratio, without finding 1%:
Printing ÷ Royalty = 25 ÷ 15 = 5/3
22,950 × 5 ÷ 3 = 7,650 × 5 = ₹ 38,250
For this quantity of books the whole expenditure is 100 × 1,530 = ₹ 1,53,000, and printing is a quarter of it.
The idea to remember: amount of any sector = given amount × (its share ÷ the given sector's share).
Why the others are wrong
- (1)₹ 46,250 — ₹ 46,250 ÷ ₹ 1,530 ≈ 30.2, so it would be about 30.2% of the expenditure. No sector in the figure has that share.
Every share in this chart is a multiple of 5%, and 5% here is ₹ 7,650. Printing's 25% is 5 × 7,650 = ₹ 38,250; even 30% would be 6 × 7,650 = ₹ 45,900, not ₹ 46,250.
- (2)₹ 36,250 — ₹ 36,250 ÷ ₹ 1,530 ≈ 23.7, so it would be about 23.7% of the expenditure, less than printing's 25%.
It is not a multiple of ₹ 7,650, the value of 5% here, so it cannot be the amount of any sector in this chart. Printing works out to 25 × 1,530 = ₹ 38,250.
- (4)₹ 42,250 — ₹ 42,250 ÷ ₹ 1,530 ≈ 27.6, so it would be about 27.6% of the expenditure, more than printing's 25%.
The ratio check gives printing exactly 22,950 × 25 ÷ 15 = ₹ 38,250. ₹ 42,250 is ₹ 4,000 above that and is not a multiple of ₹ 7,650, the value of 5% here.
Concept
A percentage pie chart divides a whole into sectors whose shares add up to 100%. Each sector's amount is total × share ÷ 100.
When the total is not given but one sector's amount is, that amount fixes the scale. Divide it by its share to get 1% of the total, then multiply by any other share.
The same result comes from a ratio: amount of sector B = amount of sector A × (share of B ÷ share of A).
Sectors with equal shares have equal amounts. Here Paper equals Printing and Binding equals Royalty.
RPSC's 2021 syllabus lists "Data Analysis (Tables, Bar diagram, Line graph, Pie-chart)" and "Percentage" under Basic Numeracy in Reasoning & Mental Ability.
A pie chart suits part-to-whole data, such as the heads of a cost or a budget. It gives proportions; rupee amounts appear only once a total, or the amount of one sector, is known.
Scaling from one sector to another is direct proportion: amount rises in the same ratio as share.
Key facts
- In a percentage pie chart, a sector's amount = total × its share ÷ 100.
- If one sector's amount is known, 1% of the total = that amount ÷ its share.
- Here royalty's 15% is ₹ 22,950, so 1% is ₹ 1,530 and printing's 25% is ₹ 38,250.
- Equal shares give equal amounts: Paper equals Printing (₹ 38,250) and Binding equals Royalty (₹ 22,950).
- The whole expenditure for this quantity of books is 100 × ₹ 1,530 = ₹ 1,53,000.
Shares as printed in the figure; amounts scaled from royalty's ₹ 22,950.
Study next
Common traps
- Taking ₹ 22,950 as the total. It is royalty's 15%; 25% of ₹ 22,950 would be only ₹ 5,737.50.
- Scaling the wrong way. Printing's share is larger than royalty's, so multiply by 25/15; 22,950 × 15/25 gives ₹ 13,770, smaller than royalty.
- Dividing by the wrong share at the unit step. 22,950 ÷ 25 = ₹ 918 is not 1%, because ₹ 22,950 belongs to the 15% sector.
A question can give one sector's amount and ask for another sector's, as this one does.
A question can also ask for the total, the difference between two sectors, the central angle of a sector, or a comparison of two pie charts with different totals.
Related PYQs
The pie-chart provided below gives the distribution of land areas used for various food crops : Choose the correct option from the following which uses more than 50% of the total area.
- (1) Wheat, Barley and Sorghum
- (2) Rice, Wheat and Sorghum
- (3) Rice, Maize and Barley
- (4) Bajra, Maize and Rice
Answer(2)
Same part-to-whole reading of a pie chart. That question gives crop areas as sector angles and asks which group uses more than 50% of the total area (RPSC's key: Rice, Wheat and Sorghum); this one gives percentages and converts one rupee amount into another.
Practice
- practice — not a real PYQ
In a pie chart of a company's expenses, Salaries are 40%, Rent 15%, Raw material 30% and Transport 15%. If Rent is ₹ 45,000, how much is spent on Raw material?
- (a)₹ 90,000
- (b)₹ 1,20,000
- (c)₹ 22,500
- (d)₹ 3,00,000
Answer(1) — 1% = 45,000 ÷ 15 = ₹ 3,000, so Raw material (30%) = ₹ 90,000. Option (2) is Salaries (40%); option (3) scales the wrong way, 45,000 × 15/30; option (4) is the whole expenditure, 100 × 3,000. - practice — not a real PYQ
A pie chart shows a family's monthly spending: Food 30%, Rent 25%, Education 20% and Others 25%. If the family spends ₹ 6,000 on Education, how much more does it spend on Food than on Rent?
- (a)₹ 1,500
- (b)₹ 3,000
- (c)₹ 1,200
- (d)₹ 7,500
Answer(1) — 1% = 6,000 ÷ 20 = ₹ 300. Food = 30 × 300 = ₹ 9,000 and Rent = 25 × 300 = ₹ 7,500, a difference of ₹ 1,500. Option (2) is Food minus Education; option (3) is 4% of the spending, not the 5% gap; option (4) is Rent itself.