
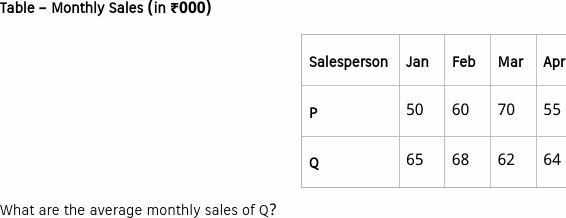
Table – Monthly Sales (in ₹000) Salesperson | Jan | Feb | Mar | Apr P | 50 | 60 | 70 | 55 Q | 65 | 68 | 62 | 64 What are the average monthly sales of Q?
- (a)₹63.5
- (b)₹64.75
- (c)₹65.75
- (d)₹65
Answer
Why
Correct — B. Average = sum ÷ count, taken along Q's row only.
Add Jan and Feb: 65 + 68 = 133
Add Mar: 133 + 62 = 195
Add Apr: 195 + 64 = 259
Divide by 4: 259 ÷ 4 = 64.75 → option (b)
Why the others are wrong
- (a)₹63.5 — ₹63.5 needs a four-month total of 4 × 63.5 = 254. Q's figures add to 259, so the average is higher.
- (c)₹65.75 — ₹65.75 needs a four-month total of 4 × 65.75 = 263, four more than Q's actual 259.
- (d)₹65 — ₹65 is Q's January figure, not its average. As an average it needs a total of 260, one more than Q's 259.
Concept
Average = sum of the values ÷ number of values. Read Q's row across Jan, Feb, Mar and Apr, and leave P's row alone.
A faster route uses deviations from a base. Take 64: the months sit at +1, +4, −2 and 0, a net +3. Spread over 4 months that is +0.75, so the average is 64.75.
The table is headed "in ₹000", but the options print ₹64.75 without the thousands. In the table's own units Q's average is ₹64.75 thousand, that is ₹64,750 a month.
Key facts
- Q's four months are 65, 68, 62 and 64, a total of 259.
- Figures in ₹000 are thousands of rupees: 64.75 means ₹64,750.
- Averaging by deviations: pick a base, average the differences, add them back.
Study next
Common traps
- Averaging P's row instead of Q's: 50 + 60 + 70 + 55 = 235, and 235 ÷ 4 = 58.75.
- Taking the first cell, ₹65 for January, as the average.
A four-value average from a table also decides 23 Sep 2024, 16:00, Quant Q.22: admissions of 450, 540, 370 and 680 total 2040, an average of 510.
14 Sep 2025, 09:00, Quant Q.6 compares row averages: product C's 150, 160 and 155 average 155, above A's 110 and B's 90.
Related PYQs
No directly related past PYQ was found.