
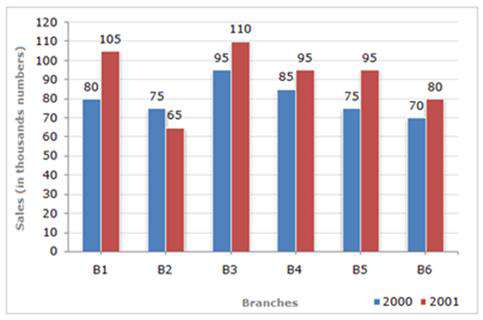
Study the given bar-graph and answer the question that follows. The bar-graph shows the sales of books (in thousands) from six branches (B1, B2, B3, B4, B5 and B6) of a publishing company during two consecutive years 2000 and 2001. What is the ratio of the total sales of branch B2 for both years to the total sales of branch B4 for both years?
- (a)3 : 5
- (b)7 : 9
- (c)2 : 3
- (d)6 : 7
Answer
Why
Correct — B. Each branch carries two bars, 2000 and 2001, and 'for both years' means add the pair.
B2: 75 + 65 = 140
B4: 85 + 95 = 180
Ratio = 140 : 180
Divide both sides by 20 → 7 : 9 → option (b).
The graph is in thousands throughout, and a unit common to both sides of a ratio cancels, so it never enters the arithmetic.
Why the others are wrong
- (a)3 : 5 — 3 : 5 would put B2 at 108 against B4's 180. B2's two bars come to 140.
- (c)2 : 3 — 2 : 3 would put B2 at 120 against B4's 180. B2 totals 140, not 120.
- (d)6 : 7 — 6 : 7 is 0.86, above the true 140⁄180 = 0.78, and would need B2 to total about 154.
Concept
A two-series bar graph pairs its bars by category: six branches, each with a 2000 bar and a 2001 bar. A question saying 'for both years' wants the pair summed, not one bar.
After that it is ratio hygiene. 140 : 180 shares a factor of 20, giving 7 : 9. Reduce before comparing, because the options are printed in lowest terms.
The 'in thousands' unit sits on both sides and cancels.
The value of every bar is printed above it — 80, 105, 75, 65 and so on — so nothing has to be measured against the axis.
B4's 2001 bar and B5's 2001 bar both read 95, which is where a hurried eye slips a column.
Key facts
- B2 sold 75 thousand in 2000 and 65 thousand in 2001, a two-year total of 140 thousand.
- B4 sold 85 thousand in 2000 and 95 thousand in 2001, a two-year total of 180 thousand.
- 140 : 180 reduces by 20 to 7 : 9.
- A unit common to both sides of a ratio cancels, so 'in thousands' does not affect the answer.
Study next
Common traps
- Using one year's bar only, because the branch label sits under a pair.
- Slipping a column between B4 and B5, whose 2001 bars are both 95.
- Leaving the answer as 140 : 180 and hunting for it in the option list.
SSC prints the values above the bars in this style of graph, so the item tests reading discipline and ratio reduction rather than estimation.
DI also runs on this paper at Quant Q.22, a production table, and Quant Q.25, an attendance graph, both 23 Sep 2024, 09:00.
Related PYQs
No directly related past PYQ was found.