
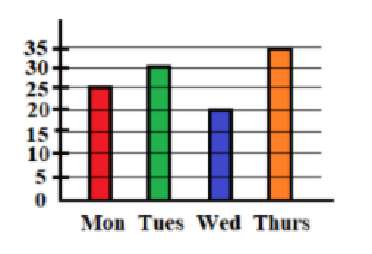
The bar graph shows the number of students present in a class on four days. The average number of students present on Monday, Tuesday and Wednesday is:
- (a)24
- (b)20
- (c)25
- (d)30
Answer
Why
Correct — C. Read the three bars the stem names and leave Thursday out.
Monday = 25
Tuesday = 30
Wednesday = 20
Sum = 25 + 30 + 20 = 75
Average = 75 ÷ 3 = 25 → option (c).
Every bar ends on a gridline and the gridlines run 0, 5, 10 … 35, so no value has to be estimated.
Why the others are wrong
- (a)24 — 24 would need the three days to total 72. They total 75.
- (b)20 — 20 is Wednesday's bar on its own — the smallest of the three, not their average.
- (d)30 — 30 is Tuesday's bar, and also the mean of Monday, Tuesday and Thursday (25 + 30 + 35 = 90, ÷ 3 = 30). That averages the wrong three days.
Concept
An average over a named subset needs two decisions before any arithmetic: which bars are in, and how many of them there are.
The stem names Monday, Tuesday and Wednesday, so Thursday's 35 is excluded from the sum and from the divisor alike. 75 over 3 days gives 25.
With gridlines every 5 units and bars ending on them, the reading is exact — the risk sits in the subset, not in the values.
The answer, 25, is also Monday's bar. A student who reads one bar and stops can land on the right option for the wrong reason, so do the addition.
The fourth bar, labelled Thurs, reaches 35 and is the value the stem does not ask about.
Key facts
- The bars read Monday 25, Tuesday 30, Wednesday 20 and Thursday 35.
- Monday, Tuesday and Wednesday total 75, so their mean is 25.
- Gridlines are 5 units apart and every bar ends on one, so no interpolation is needed.
- Replacing Wednesday with Thursday moves the mean from 25 to 30.
Study next
Common traps
- Averaging all four days, 110 ÷ 4 = 27.5, which is not on the option list.
- Adding the three named days but dividing by 4.
- Reading one bar because the answer 25 happens to match Monday.
SSC keeps attendance and sales bar graphs to a handful of bars and asks for a mean, a difference or a ratio over a named subset.
The same reading work is asked on this paper at Quant Q.22, a production table, and Quant Q.23, a two-series sales graph, both 23 Sep 2024, 09:00.
Related PYQs
No directly related past PYQ was found.