
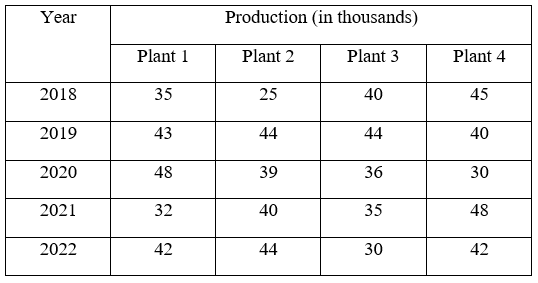
Study the given table and answer the question that follows. The following table shows the production of printers by four plants of a company over the five years. What is the difference between the average production of plant 1 and plant 2 during five years?
- (a)1400
- (b)1600
- (c)3000
- (d)3840
Answer
Why
Correct — B. The table header reads Production (in thousands), so every figure in the grid is a count of thousands.
Plant 1: 35 + 43 + 48 + 32 + 42 = 200
Plant 2: 25 + 44 + 39 + 40 + 44 = 192
Both averages divide by the same 5, so subtract the totals first:
200 − 192 = 8
8 ÷ 5 = 1.6 thousand
1.6 thousand = 1,600 printers → option (b).
Why the others are wrong
- (a)1400 — 1,400 is 1.4 thousand, which would need the two five-year totals to differ by 7. They differ by 8.
- (c)3000 — 3,000 is 3 thousand, needing a gap of 15 between the totals — nearly twice the real gap of 8.
- (d)3840 — 3,840 is Plant 2's own average, 38.4 thousand, scaled by 100. The stem asks for the difference between two averages, not for one of them.
Concept
When two averages run over the same number of years, the subtraction shortcut is safe: (sum₁ − sum₂) ÷ 5 equals average₁ − average₂.
Plant 1 averages 200 ÷ 5 = 40 thousand and Plant 2 averages 192 ÷ 5 = 38.4 thousand, a gap of 1.6 thousand.
In table DI the marks go on the header line, not on the addition. 'In thousands' is what turns 1.6 into 1,600.
The table is a plain grid — years 2018 to 2022 down the side, Plant 1 to Plant 4 across — and two of those four columns are all this question uses.
All four options are whole numbers of printers, which confirms the answer is wanted in units rather than in thousands.
Key facts
- Plant 1's five-year total is 200 thousand, an average of 40 thousand.
- Plant 2's five-year total is 192 thousand, an average of 38.4 thousand.
- When two means share a divisor, the difference of the means is the difference of the totals over that divisor.
- The header says thousands, so a difference of 1.6 on the table is 1,600 printers.
Study next
Common traps
- Answering 1.6 and never converting out of thousands.
- Adding four of the five years because the eye skips a row.
- Subtracting a single year's figures, such as 2018's 35 − 25 = 10, instead of the averages.
Table DI at SSC is deliberately light arithmetic wrapped in a units line: the addition is easy and the thousands are where the marks go.
Bar-graph DI also appears on this paper (23 Sep 2024, 09:00): Quant Q.4 splits six countries about their mean, Q.25 averages three days of attendance, and Q.23 takes a ratio of two branches' totals.
Related PYQs
No directly related past PYQ was found.