
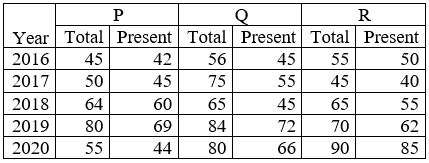
The following table shows the total candidates appeared and number of candidates present, in different exam centres – P, Q and R. Study the table and answer the question that follows. ‘Total’ denotes total candidates applied for the centre,‘Present’ denotes the candidates appeared. In which year was the number of absentees the second highest in total of all centres?
- (a)2018
- (b)2019
- (c)2020
- (d)2017
Answer
Why
Correct — B. Absentees are not printed, so build the column: Absent = Total − Present, summed over centres P, Q and R.
2016: 3 + 11 + 5 = 19
2017: 5 + 20 + 5 = 30
2018: 4 + 20 + 10 = 34
2019: 11 + 12 + 8 = 31
2020: 11 + 14 + 5 = 30
2018 is the highest at 34, so the second highest is 2019 at 31 → option (b).
Why the others are wrong
- (a)2018 — 2018 has 34 absentees, the highest total of the five years — one place above what the question asks for.
- (c)2020 — 2020 has 30 absentees (11 + 14 + 5), which ties it with 2017 for third, four short of the second-place 31.
- (d)2017 — 2017 also has 30 absentees (5 + 20 + 5). It matches 2020 exactly, so neither year can be the single second highest.
Concept
The table pairs two sub-columns, Total (applied) and Present (appeared), for each of three centres P, Q and R across 2016 to 2020.
The quantity asked about — absentees — appears nowhere in it. You have to derive it row by row, then add the three centres before ranking.
Ranking on a derived total is the standard second layer in SSC table DI: the arithmetic is trivial, the bookkeeping is where marks are lost.
The table is an image in the paper. Two years tie at 30 absentees, so only the first and second places are unambiguous — which is exactly what the question asks for.
Key facts
- Absent = Total applied − Present, taken centre by centre and then summed for the year.
- Year totals from this table are 2016 = 19, 2017 = 30, 2018 = 34, 2019 = 31, 2020 = 30.
- 2018 is highest and 2019 second, with 2017 and 2020 tied at 30 behind them.
Study next
Common traps
- Ranking by the biggest single-centre gap — centre Q loses 20 in both 2017 and 2018 — instead of by the year total
- Reading 'second highest' as the second-largest Total applied rather than the second-largest number of absentees
- Stopping at 2018 because it is the largest figure the arithmetic produces
SSC prints a two-tier Total/Present table and asks for absentees — a column it never shows. Deriving it is the work; the ranking is trivial once the column exists.
Same shift, Quant Q.6 and Q.8 are also table items: Q.6 converts percentage marks back into raw marks against a 105-mark pass line, Q.8 asks who averaged 79% across five subjects.
Related PYQs
No directly related past PYQ was found.