
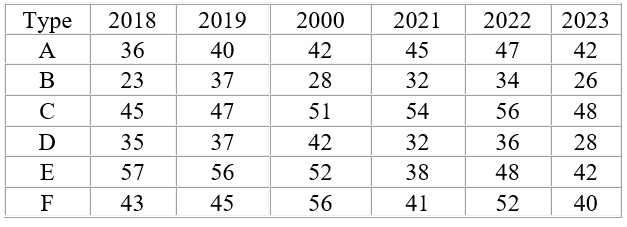
Study the given table and answer the question. The table displays the number of cars produced (in lakhs) by six different brands between 2018 and 2023. Find the difference in the average production of B and D during 2018-2023.
- (a)5.5 lakhs
- (b)6 lakhs
- (c)5 lakhs
- (d)4 lakhs
Answer
Why
Correct — C. The table runs six year columns, so both averages divide by 6.
Row B: 23 + 37 + 28 + 32 + 34 + 26 = 180
Average of B = 180 ÷ 6 = 30
Row D: 35 + 37 + 42 + 32 + 36 + 28 = 210
Average of D = 210 ÷ 6 = 35
Difference = 35 − 30 = 5 lakhs, which is option (c).
Faster route: the divisor is shared, so subtract the totals once — (210 − 180) ÷ 6 = 5.
Why the others are wrong
- (a)5.5 lakhs — Option (a), 5.5 lakhs, needs the two row totals to differ by 33, since 5.5 × 6 = 33. D − B is 210 − 180 = 30, and 30 ÷ 6 leaves no half.
- (b)6 lakhs — Option (b), 6 lakhs, is 30 ÷ 5 — the gap divided by five year columns instead of six. The header printed as 2000 is exactly what makes that column easy to skip.
- (d)4 lakhs — Option (d), 4 lakhs, is 24 ÷ 6, so it needs D to total 204. Row D adds to 210, and the six entries 35, 37, 42, 32, 36 and 28 leave no room for 204.
Concept
An average off a table row is the row total divided by the number of columns, so the first thing to fix is how many columns there are.
When two averages share the same divisor, their difference is the difference of the totals divided by that divisor. Here 210 − 180 = 30 and 30 ÷ 6 = 5, which skips two divisions.
Everything stays in lakhs throughout because the table is already stated in lakhs — no conversion is needed at the end.
The third column heading is printed 2000 where the run is otherwise 2018, 2019, 2021, 2022, 2023. The stem says 2018–2023, so it is the paper's typo for 2020, and it changes nothing: the column still counts, and the divisor is still six.
Key facts
- Row B reads 23, 37, 28, 32, 34, 26 and totals 180, so its average is 30 lakhs.
- Row D reads 35, 37, 42, 32, 36, 28 and totals 210, so its average is 35 lakhs.
- Two averages over the same number of terms differ by the difference of their totals over that number.
- The table's third column is printed 2000, a misprint for 2020 in a 2018 to 2023 run.
Study next
Common traps
- Counting five year columns instead of six because the third is printed 2000.
- Sliding a row while reading, since B and D are separated by C in a six-row table.
- Averaging the two rows separately when one subtraction of totals would do.
SSC keeps the arithmetic small in this family and puts the difficulty in reading the right two rows across the right span. A production table over a run of years is read the same way at 25 Sep 2024, 16:00, Quant Q.9, and a bar graph asks for an all-years average at Quant Q.25 of this shift.
Related PYQs
No directly related past PYQ was found.