
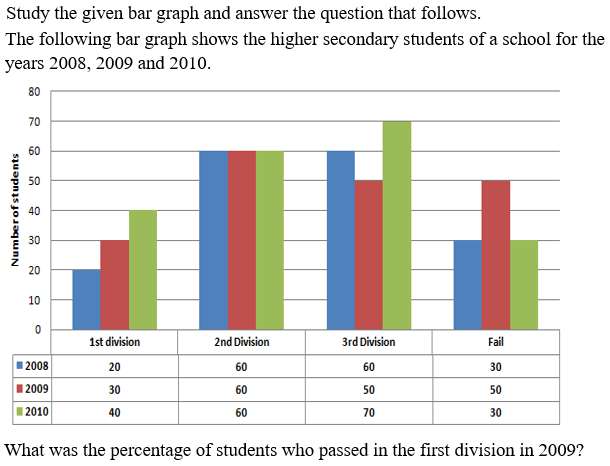
Study the given bar graph and answer the question that follows. The following bar graph shows the higher secondary students of a school for the years 2008, 2009 and 2010. Number of students → 1st division | 2nd Division | 3rd Division | Fail 2008 — 20 | 60 | 60 | 30 2009 — 30 | 60 | 50 | 50 2010 — 40 | 60 | 70 | 30 What was the percentage of students who passed in the first division in 2009?
- (a)

- (b)

- (c)

- (d)

Answer
Why
Correct — D. The stem is an image: a grouped bar graph of a school's higher secondary students for 2008, 2009 and 2010, with a table under it repeating every value. It asks for the percentage in the first division in 2009.
The 2009 row reads first division 30, second 60, third 50, fail 50.
Total 2009 students = 30 + 60 + 50 + 50 = 190
Share = 30⁄190 × 100 = 3000⁄190 = 300⁄19
300 ÷ 19 = 15, remainder 15
So the value is 15 15⁄19 %, which is option (d).
Why the others are wrong
- (a)Option (a) 16 15⁄19 % has the right fractional part with the wrong whole number. 19 × 16 = 304, which already overshoots 300, so the quotient is 15.
- (b)Option (b) 15 13⁄19 % has the right whole number and the wrong remainder. 19 × 15 = 285, and 300 − 285 = 15, not 13.
- (c)Option (c) 16 13⁄19 % misses on both counts. 300⁄19 is 15 whole with 15 over, so neither the 16 nor the 13 survives.
Concept
The denominator is the decision. The percentage is taken over all the students shown for that year — the 190 on the 2009 bars — not over the 140 who passed.
Every option shares the denominator 19, which is the signature of 300⁄19. So once you reach 3000⁄190, the remaining work is only converting an improper fraction to a mixed number.
Divide: 300 ÷ 19 gives 15, and 19 × 15 = 285 leaves a remainder of 15. That is 15 15⁄19.
Taken over the 140 who passed instead, 30⁄140 would be 21 3⁄7 %, which is not offered. The option list is what settles the reading at 30 out of 190.
Key facts
- The 2009 bars read 30 in first division, 60 in second, 50 in third and 50 failing.
- The 2009 total on this chart is 190 students.
- 30 ÷ 190 × 100 = 300⁄19, and 300 = 19 × 15 + 15.
- All four options are mixed fractions over 19, differing only in the whole number and the numerator.
Study next
Common traps
- Dividing by the 140 who passed rather than the 190 on the chart.
- Reading the 2008 or 2010 bar, which give 20 and 40 in first division.
- Rounding 300⁄19 to 15.8% when the options are mixed fractions.
Percentages read straight off a chart recur. 10 Sep 2024, 09:00, Quant Q.12 asks a percentage off a bar graph of book sales from six schools in 2013 and 2014, and 09 Sep 2024, 12:30, Quant Q.20 works a ratio off a bar graph of students enrolled in Institutes A and B.
Related PYQs
No directly related past PYQ was found.