
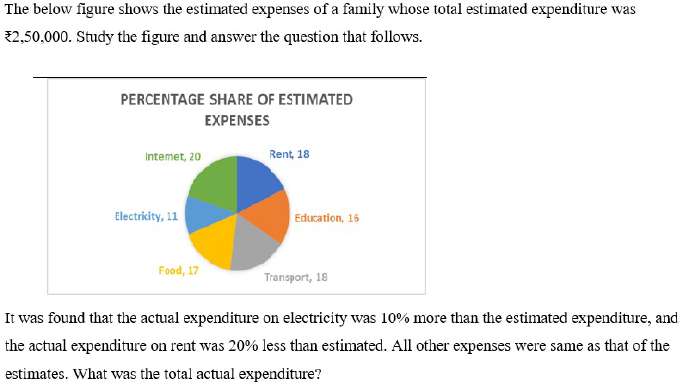
The below figure shows the estimated expenses of a family whose total estimated expenditure was ₹2,50,000. Study the figure and answer the question that follows. PERCENTAGE SHARE OF ESTIMATED EXPENSES Rent — 18 Education — 16 Transport — 18 Food — 17 Electricity — 11 Internet — 20 It was found that the actual expenditure on electricity was 10% more than the estimated expenditure, and the actual expenditure on rent was 20% less than estimated. All other expenses were same as that of the estimates. What was the total actual expenditure?
- (a)₹2,40,750
- (b)₹2,52,500
- (c)₹2,48,750
- (d)₹2,43,750
Answer
Why
Correct — D. Only two heads move, so price each change in rupees and adjust the ₹2,50,000 estimate.
Electricity estimate = 11% of 2,50,000 = ₹27,500
10% more → 27,500 × 1.10 = ₹30,250, a rise of +₹2,750
Rent estimate = 18% of 2,50,000 = ₹45,000
20% less → 45,000 × 0.80 = ₹36,000, a fall of −₹9,000
Net change = 2,750 − 9,000 = −₹6,250
Actual total = 2,50,000 − 6,250 = ₹2,43,750 → option (d)
Why the others are wrong
- (a)₹2,40,750 — ₹2,40,750 needs the total to fall by ₹9,250. The two heads that move give −₹9,000 on rent and +₹2,750 on electricity, a net fall of ₹6,250 — no reading of the pie reaches ₹9,250.
- (b)₹2,52,500 — ₹2,52,500 sits above the ₹2,50,000 estimate. The rent cut removes ₹9,000 while electricity puts back only ₹2,750, so the actual bill has to finish below the estimate, not above it.
- (c)₹2,48,750 — ₹2,48,750 is only ₹1,250 below the estimate — far too small a fall, when the rent cut alone takes off ₹9,000 and electricity returns just ₹2,750.
Concept
A pie chart labelled in per cent is a set of rupee amounts in disguise: each slice is that per cent of the stated total, here ₹2,50,000.
Convert the slices you need into rupees before touching the percentages in the question. A 10% rise on the electricity bill is 10% of ₹27,500, not ten points added to the 11 in the chart.
Every slice the question does not name stays at its estimate. So the new total is the old total plus one rupee rise minus one rupee fall, and the other four slices never enter the working.
The stem is an image. The pie is labelled Rent 18, Education 16, Transport 18, Food 17, Electricity 11 and Internet 20, and those six labels add to 100, so the percentages can be read straight as shares of ₹2,50,000.
Key facts
- 11% of ₹2,50,000 is ₹27,500, and a 10% rise on that is ₹2,750.
- 18% of ₹2,50,000 is ₹45,000, and a 20% cut on that is ₹9,000.
- Actual total = estimate + rise − fall = 2,50,000 + 2,750 − 9,000 = ₹2,43,750.
Study next
Common traps
- Raising the 11 in the chart to 21 — the 10% is a rise on the electricity amount, not ten points added to its share
- Recomputing all six slices when only two of them were disturbed
Also asked 9 Sep 2024, 12:30, Quant Q.4 (a ₹54,000 monthly income split by a pie) and 24 Sep 2024, 16:00, Quant Q.9 (a pie slice converted into a central angle).
Related PYQs
No directly related past PYQ was found.