
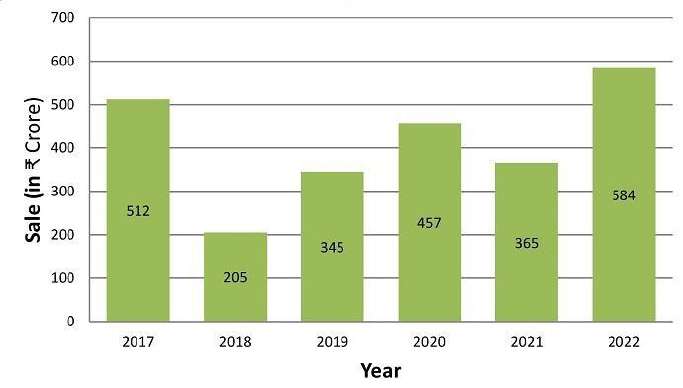
The following bar graph shows the sales of a company (in ₹ crore) in different years. Study the graph and answer the question. The mean of the highest and lowest sales (in ₹ crore) is:
- (a)394.5
- (b)326.7
- (c)484.2
- (d)412.3
Answer
Why
Correct — A. Mean of the highest and lowest means the average of those two bars only, not of all six.
The printed labels are 512, 205, 345, 457, 365 and 584.
Highest = 584 (2022)
Lowest = 205 (2018)
Sum = 584 + 205 = 789
Mean = 789 ÷ 2 = 394.5 → option (a).
Why the others are wrong
- (b)326.7 — Two whole bars cannot average to 326.7. That would need the pair to sum to 653.4, and every bar here is labelled with a whole number, so no two of them average to a figure ending in .7.
- (c)484.2 — A midpoint cannot sit above the second-highest bar. The mean of 584 and 205 lies halfway between them, so it must fall well below 457, while 484.2 is higher than every bar except 512 and 584.
- (d)412.3 — This sits beside the average of all six years. 512 + 205 + 345 + 457 + 365 + 584 = 2468, and 2468 ÷ 6 ≈ 411.3 — the whole-graph average, which is not what the stem asked for.
Concept
Two separate skills are being tested. The first is selection: deciding which bars the stem actually wants before any arithmetic starts.
The second is that the mean of two numbers is their midpoint. That gives you a free sanity check — the answer must land between 205 and 584, and nearer the middle of that span than either end.
Every bar here carries its value inside it, so estimating heights against the gridlines only introduces error.
Sales run 512, 205, 345, 457, 365, 584 across 2017 to 2022, so the series is not monotonic — the highest and lowest years sit at opposite ends of the run and neither is the first bar.
Key facts
- The bars are labelled 512, 205, 345, 457, 365 and 584 for 2017 through 2022.
- The highest sale is 584 crore in 2022 and the lowest is 205 crore in 2018.
- The mean of any two whole numbers ends in .0 or .5, never .3 or .7.
Study next
Common traps
- Averaging all six years instead of the two extremes
- Taking 512 as the highest because 2017 is the first tall bar, when 2022 reaches 584
- Estimating bar heights from the gridlines when exact labels are printed inside the bars
Read which bars the stem picks out before you average anything — the selection is where this shape of item is won or lost.
25 Sep 2024, 09:00, Quant Q.25 asks for the average imports of all the years, and 23 Sep 2024, 09:00, Quant Q.25 for the average across three named days.
Related PYQs
No directly related past PYQ was found.