
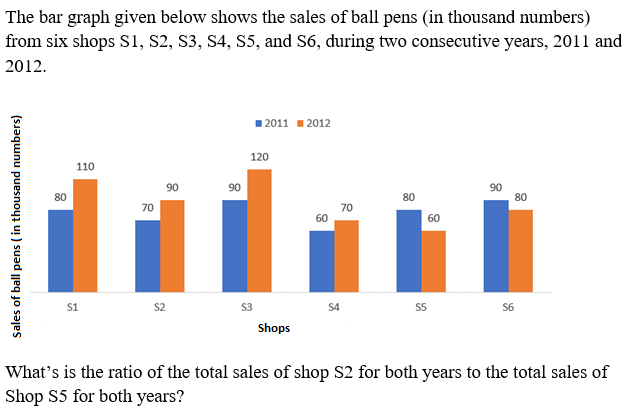
The bar graph given below shows the sales of ball pens (in thousand numbers) from six shops S1, S2, S3, S4, S5, and S6, during two consecutive years, 2011 and 2012. Sales of ball pens (in thousand numbers) Shops → S1 | S2 | S3 | S4 | S5 | S6 2011 — 80 | 70 | 90 | 60 | 80 | 90 2012 — 110 | 90 | 120 | 70 | 60 | 80 What's is the ratio of the total sales of shop S2 for both years to the total sales of Shop S5 for both years?
- (a)5 : 8
- (b)3 : 7
- (c)7 : 5
- (d)8 : 7
Answer
Why
Correct — D. The stem asks for S2's two-year total set against S5's two-year total, so read one pair of bars per shop and add each pair.
S2: 2011 = 70, 2012 = 90
S2 total = 70 + 90 = 160
S5: 2011 = 80, 2012 = 60
S5 total = 80 + 60 = 140
Ratio = 160 : 140
Divide both sides by the HCF, 20 → 8 : 7 → option (d).
Why the others are wrong
- (a)5 : 8 — S2 is the larger of the two, so it cannot come first in 5 : 8. S2's two years total 160 against S5's 140, and a 5 : 8 reading would need S5 to reach 256.
- (b)3 : 7 — This compares S5 with itself. 60 : 140 — S5's 2012 bar against S5's own two-year total — is exactly 3 : 7. The first number has to be S2's total, 160.
- (c)7 : 5 — Reversing the order gives 7 : 8, not 7 : 5. The totals are 160 and 140, so S5 : S2 is 7 : 8. A 7 : 5 ratio would need S5 to total about 114, which no pair of bars on this chart gives.
Concept
This is a grouped bar chart: each shop gets two bars, blue for 2011 and orange for 2012, and every bar carries its value as a printed label. Nothing has to be measured off the axis.
The phrase that does the work is for both years — it turns each shop into a single number by adding its pair. Only after that addition is there a ratio to form.
Then reduce by the HCF rather than by trial: 160 and 140 are both multiples of 20, which takes the ratio to 8 : 7 in one step.
The entire stem is inside the picture on this item; the question field of the paper is blank.
The printed wording is "What's is the ratio of the total sales of shop S2 for both years to the total sales of Shop S5 for both years?" — the doubled verb is the Commission's own typo, and it changes nothing about what is being asked.
Key facts
- S2's bars read 70 for 2011 and 90 for 2012, giving a two-year total of 160 thousand pens.
- S5's bars read 80 for 2011 and 60 for 2012, giving a two-year total of 140 thousand pens.
- 160 : 140 divides through by 20 to give 8 : 7.
- Sales are in thousand numbers, so S2's 160 stands for 160,000 pens — the unit cancels inside a ratio.
Study next
Common traps
- Answering from a single year's bars because the eye settles on one colour
- Writing the ratio backwards — the stem names S2 first and S5 second
- Reaching 160 : 140 correctly and then ticking 7 : 8
SSC prints the whole stem inside the image on chart items like this, so the deciding phrase — for both years — sits above the graph rather than in the question line.
The same grouped-bar ratio reading is asked at 09 Sep 2024, 12:30, Quant Q.20 (Institute B's enrolment in three years against Institute A's in three others) and at 17 Sep 2024, 12:30, Quant Q.14 (targeted production against actual).
Related PYQs
No directly related past PYQ was found.