
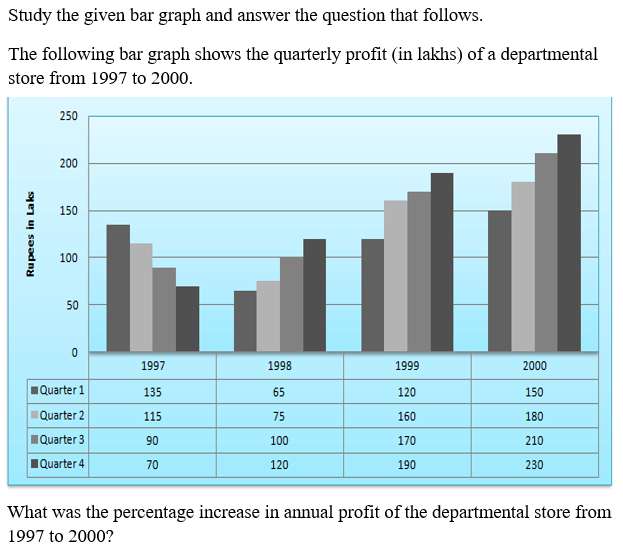
Study the given bar graph and answer the question that follows. The following bar graph shows the quarterly profit (in lakhs) of a departmental store from 1997 to 2000. Rupees in Laks Year → 1997 | 1998 | 1999 | 2000 Quarter 1 — 135 | 65 | 120 | 150 Quarter 2 — 115 | 75 | 160 | 180 Quarter 3 — 90 | 100 | 170 | 210 Quarter 4 — 70 | 120 | 190 | 230 What was the percentage increase in annual profit of the departmental store from 1997 to 2000?
- (a)

- (b)

- (c)

- (d)

Answer
Why
Correct — A. Annual profit is the sum of the four quarters, so add each column of the data table printed under the bars.
1997 = 135 + 115 + 90 + 70 = 410 lakh
2000 = 150 + 180 + 210 + 230 = 770 lakh
Increase = 770 − 410 = 360 lakh
Percentage increase = 360/410 × 100 = 3600/41
41 × 87 = 3567, leaving 33.
So the value is 87 33/41 % → option (a).
Why the others are wrong
- (b)Applying 84 33/41 % to 410 lakh adds only 347.7 lakh, which would put 2000 at 757.7 lakh instead of 770. The tail 33/41 is common to all four options, so the whole number decides.
- (c)83 33/41 % of 410 lakh is 343.6 lakh of growth, leaving 2000 at 753.6 lakh. It is the smallest decoy and fails the same reconstruction check.
- (d)85 33/41 % of 410 lakh adds 351.8 lakh, giving 761.8 lakh for 2000 — still short. Only 87 covers the gap of 360 lakh exactly.
Concept
Percentage increase compares the change to the starting value, never to the final one: (new − old) / old × 100.
Annual profit is not a single bar here. The graph plots four quarterly bars for each year, so each year's figure has to be built by adding its column.
The answer stays a mixed fraction because 3600 divided by 41 does not terminate. Finish the division instead of rounding: 41 × 87 = 3567, and the remainder 33 sits over the same 41.
The chart carries its own data table beneath the bars, so no bar height has to be judged by eye — the sixteen quarterly figures are printed.
Key facts
- Percentage increase = (new value − old value) / old value × 100, with the old value in the denominator.
- The 1997 annual profit from the table is 135 + 115 + 90 + 70 = 410 lakh.
- The 2000 annual profit from the table is 150 + 180 + 210 + 230 = 770 lakh.
- 3600 divided by 41 is 87 remainder 33, which is why every option carries the tail 33/41.
Study next
Common traps
- Dividing the 360 lakh increase by the 2000 total of 770 rather than by the 1997 total of 410
- Comparing one quarter of 1997 with one quarter of 2000 instead of the annual totals
- Rounding 87.8 to 88 when every option is an exact mixed fraction
SSC pairs a bar graph with a single arithmetic step — a total, a ratio or a percentage change. This shift asks for a bar-graph mean at Quant Q.11, and a bar-graph average comparison is asked 13 Sep 2024, 09:00, Quant Q.16.
Related PYQs
No directly related past PYQ was found.