
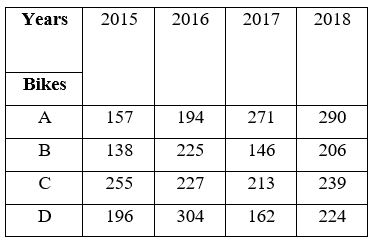
The table shows the production of different types of bikes (in thousands). The number of years, in which the production of bikes of type C is less than the average production of type A bikes over the years is
- (a)4%
- (b)2%
- (c)1%
- (d)3%
Answer
Why
Correct — B. First reduce the type A row to its average:
(157 + 194 + 271 + 290) ÷ 4
= 912 ÷ 4 = 228
Now read the type C row against 228.
2015: 255 above
2016: 227 below
2017: 213 below
2018: 239 above
2 years fall below the average, and 2 is the numeral option (b) carries.
Why the others are wrong
- (a)4% — The numeral here is 4, which counts every year. That needs all four type C figures under 228, but 255 in 2015 and 239 in 2018 are above it.
- (c)1% — The numeral here is 1, which catches 2017 and misses 2016. Type C in 2016 is 227, one single unit under the 228 average, and the whole question turns on that unit.
- (d)3% — The numeral here is 3, which would need 255 or 239 to fall below 228 as well. Both clear it by more than ten.
Concept
Two steps, in this order. Reduce one row of the table to a single number — the mean of the type A row, 912 ÷ 4 = 228.
Then treat that number as a threshold and scan the type C row, counting the entries that fall under it.
The comparison is entry by entry, not total against total. Comparing the type C average with the type A average answers a different question and returns a size, not a count.
The options as lifted from the response sheet read 4%, 2%, 1% and 3%, but the stem asks for a number of years, not a percentage — the per cent signs are stray.
Read the numerals: the key marks the option carrying 2, which is the count the table gives.
Key facts
- Type A production over 2015-2018 is 157, 194, 271 and 290 thousand, averaging 228 thousand.
- Type C production is 255, 227, 213 and 239 thousand, of which only 227 and 213 fall below 228.
- The table is labelled in thousands throughout, so the units cancel in any comparison within it.
Study next
Common traps
- Comparing the type C average with the type A average instead of counting individual years
- Missing 227 in 2016, which sits one unit below the 228 threshold
- Chasing a percentage because of the stray per cent signs printed on the options
SSC builds table questions as a totals-to-totals percentage, a single-year ratio, or a count against a computed average like this one.
The percentage version runs at Quant Q.8 of this same shift, on a five-year expenditure table, and a bar graph of actual against targeted car production is set at Quant Q.14.
Related PYQs
No directly related past PYQ was found.