
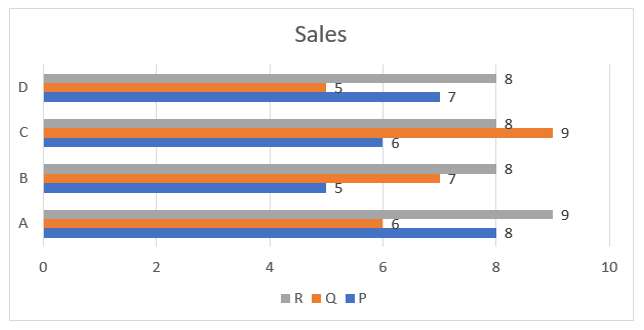
Study the given graph and answer the question that follows. The graph shows the sales of three products: P, Q and R by four companies: A, B, C and D. What percentage is the total production by company C, of the total production by company A?
- (a)110%
- (b)90%
- (c)105%
- (d)100%
Answer
Why
Correct — D. Every bar in the chart carries its own printed value, so total each company's three bars rather than measuring against the axis.
Company A: P = 8, Q = 6, R = 9 → 23
Company C: P = 6, Q = 9, R = 8 → 23
The two are the same three numbers in a different order, so the totals must match.
Percentage = (C ⁄ A) × 100 = (23 ⁄ 23) × 100 = 100% → option (d)
Why the others are wrong
- (a)110% — 110% would need C to reach 25.3 against A's 23. C's labelled bars are 6, 9 and 8, which come to 23 exactly, so there is no surplus to find.
- (b)90% — 90% puts C about 2.3 units behind A. C carries the same three values as A — 6, 9, 8 against 8, 6, 9 — so neither company can trail the other.
- (c)105% — 105% needs C to beat A by roughly one unit, the size of a single misread bar. Re-check C's grey R bar, which reads 8, not 9.
Concept
'X as a percentage of Y' is (X ⁄ Y) × 100, and the company named second is the base worth 100. Here that base is company A.
The item is built so that per-product comparison misleads. C beats A on product Q by 3, A beats C on P by 2 and on R by 1, and those cancel exactly.
That is the general lesson of a grouped bar chart: a lead on one series says nothing about the total until all the series are added.
The chart is titled 'Sales' while the question asks about 'production'. That is SSC's own wording, and it changes nothing here, since a single set of bars is all there is to read.
Values are printed at the end of every bar, so the axis running 0 to 10 never has to be interpolated.
Key facts
- Company A's bars read P = 8, Q = 6 and R = 9, totalling 23.
- Company C's bars read P = 6, Q = 9 and R = 8, totalling 23.
- In 'X as a percentage of Y', Y is the denominator and the base worth 100.
- Equal totals give exactly 100%, however differently the totals are split across products.
Study next
Common traps
- Comparing C and A product by product and declaring a winner before adding the three bars.
- Reading company A's grey R bar as 8, the value it takes for the other three companies.
- Swapping numerator and denominator, which is harmless at 100% here but wrong on every other pair in the chart.
SSC sets a grouped bar chart with every bar labelled and asks for one company against another, so the marks go to careful adding rather than to estimating heights.
A near-identical 'company C, what percentage' ask runs at 9 Sep 2024, 16:00, Quant Q.4, where C is set against the combined total instead of against one rival, and a branch-versus-branch version at 10 Sep 2024, 12:30, Quant Q.21.
Related PYQs
No directly related past PYQ was found.