
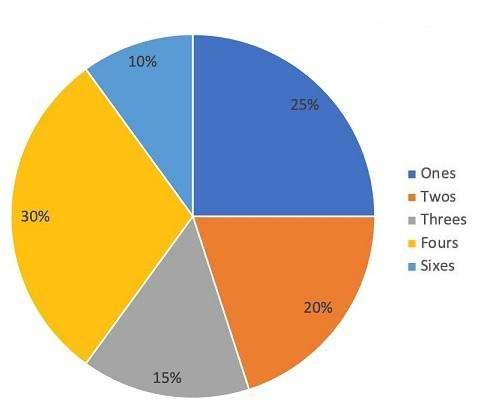
The given pie-chart shows the percentage distribution of runs scored by a batsman in a test innings. Study the chart and answer the question that follows. If the batsman has scored a total of 440 runs, how many runs did he score by hitting fours?
- (a)224
- (b)172
- (c)132
- (d)88
Answer
Why
Correct — C. Read the slice before the sum: the Fours sector of the pie chart is the yellow one, labelled 30%, and the chart distributes runs scored, not deliveries.
1% of the innings = 440 ⁄ 100 = 4.4 runs
Fours = 30 × 4.4
= 132 runs → option (c)
Sanity check: the five sectors read 25 + 20 + 15 + 30 + 10 = 100, so the chart is complete and 30% is genuinely the largest slice.
Why the others are wrong
- (a)224 — 224 is not a figure this chart can produce. Every sector is a whole multiple of 5%, and 5% of 440 is 22 runs, so any sector or group of sectors is a multiple of 22 — and 224 is not.
- (b)172 — 172 fails the same test: 22 × 7 = 154 and 22 × 8 = 176, so no slice or combination of slices totals 172 runs.
- (d)88 — 88 is a real figure from this chart, but it is the Twos sector — 20% of 440. The Fours sector is the 30% one, worth 132 runs.
Concept
A pie chart hands you percentages and the stem hands you the whole, so one multiplication finishes the job. Fix the unit first: 1% of 440 = 4.4 runs, and every sector is its percentage times 4.4.
Two readings are being tested at once. Fours names the sector, and the chart's own title says it distributes runs scored — so 132 is a number of runs, not a number of boundaries. Those 132 runs would be 33 fours.
The five sectors sum to 100%, which is the check to run before trusting any single one of them.
The chart labels the slices but not the values, and the legend is colour-coded, so the sector must be matched by colour before the arithmetic starts. Fours is the yellow 30% slice; Twos is the orange 20% one.
Key facts
- The chart reads Ones 25%, Twos 20%, Threes 15%, Fours 30%, Sixes 10%, totalling 100%.
- On a 440-run innings, 1% is 4.4 runs and 5% is 22 runs.
- Fours: 30% of 440 = 132 runs.
- Because every sector is a multiple of 5%, every legitimate answer is a multiple of 22 runs.
Study next
Common traps
- Answering the number of fours rather than the runs those fours produced.
- Matching the legend to the wrong colour, and taking 20% instead of 30%.
- Carrying the same total into a follow-up question that changes the innings figure.
SSC prints the chart in percentages and puts the total in the stem, then asks for something a step or two past reading one slice.
At 12 Sep 2024, 12:30, Quant Q.6 (20,000 employees) you read department D's sector and then take 70% of it for the male count. At 24 Sep 2024, 16:00, Quant Q.21 (240 blood donors) it is a ratio across four sectors, and the printed total cancels out.
Quant Q.17 of this paper reads a table and Quant Q.1 a graph the same way: identify the row or slice first, then compute.
Related PYQs
No directly related past PYQ was found.