
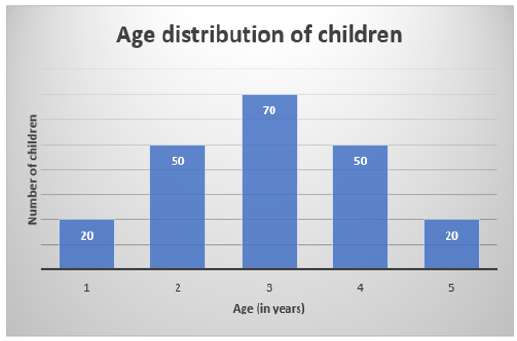
The given graph represents the data on the ages of various children. Study the given graph and answer the question that follows. What is the difference between the mean and mode of the ages?
- (a)0.5
- (b)1
- (c)0
- (d)2
Answer
Why
Correct — C. Read the frequencies printed on the bars.
Age 1 → 20 children, age 2 → 50, age 3 → 70, age 4 → 50, age 5 → 20.
Total children = 20 + 50 + 70 + 50 + 20 = 210
Σ(age × children) = 20 + 100 + 210 + 200 + 100 = 630
Mean = 630⁄210 = 3 years
Mode = the age carrying the tallest bar = 3 years (70 children)
Difference = 3 − 3 = 0 → option (c)
Why the others are wrong
- (a)0.5 — 0.5 would need the mean to land half a year off a whole age. The weighted mean is exactly 630⁄210 = 3, and 3 is also the mode, so no half-year gap can open up.
- (b)1 — 1 is the gap you get by calling the mode 2 or 4 — the two bars of height 50. Those tie with each other; the highest frequency is 70, at age 3.
- (d)2 — 2 is the distance from age 3 to age 1 or age 5, the two shortest bars. The mode is the most frequent value, not the least frequent one.
Concept
Two statistics, two different readings of the same bar graph.
The mean of a frequency distribution is Σ(value × frequency) ÷ Σ(frequency) — every child at age 3 pulls the average, so the 70 children there weigh three and a half times as much as the 20 at age 1.
The mode needs no arithmetic at all: it is the value sitting under the tallest bar.
This distribution is symmetric about age 3 — 20, 50, 70, 50, 20 — and in a symmetric distribution the mean, the median and the mode all fall on the same value.
The frequencies are printed inside the bars (20, 50, 70, 50, 20), so nothing has to be estimated against the y-axis, which carries no numbers.
Key facts
- The mean of a frequency table is Σ(value × frequency) ÷ Σ(frequency), not the plain average of the distinct values.
- The mode is the value that occurs most often — age 3, carried by 70 children — not the largest value and not the largest frequency.
- In a perfectly symmetric distribution the mean, median and mode coincide.
- Here Σf = 210 and Σfx = 630, so the mean is exactly 3.
Study next
Common traps
- Averaging the five ages as (1 + 2 + 3 + 4 + 5) ÷ 5, which ignores how many children sit at each age.
- Calling 70 the mode — 70 is the frequency, the mode is the age 3 that carries it.
- Answering 0 straight off the symmetry of the picture without confirming the mean from the numbers.
SSC prints the frequencies on the bars and then asks for one statistic, or for the difference of two. A labelled bar graph is read the same way at Quant Q.11 of the 19 Sep 2024, 12:30 sitting, which wants the mean of the highest and lowest sales.
Related PYQs
No directly related past PYQ was found.