 View answer copy →
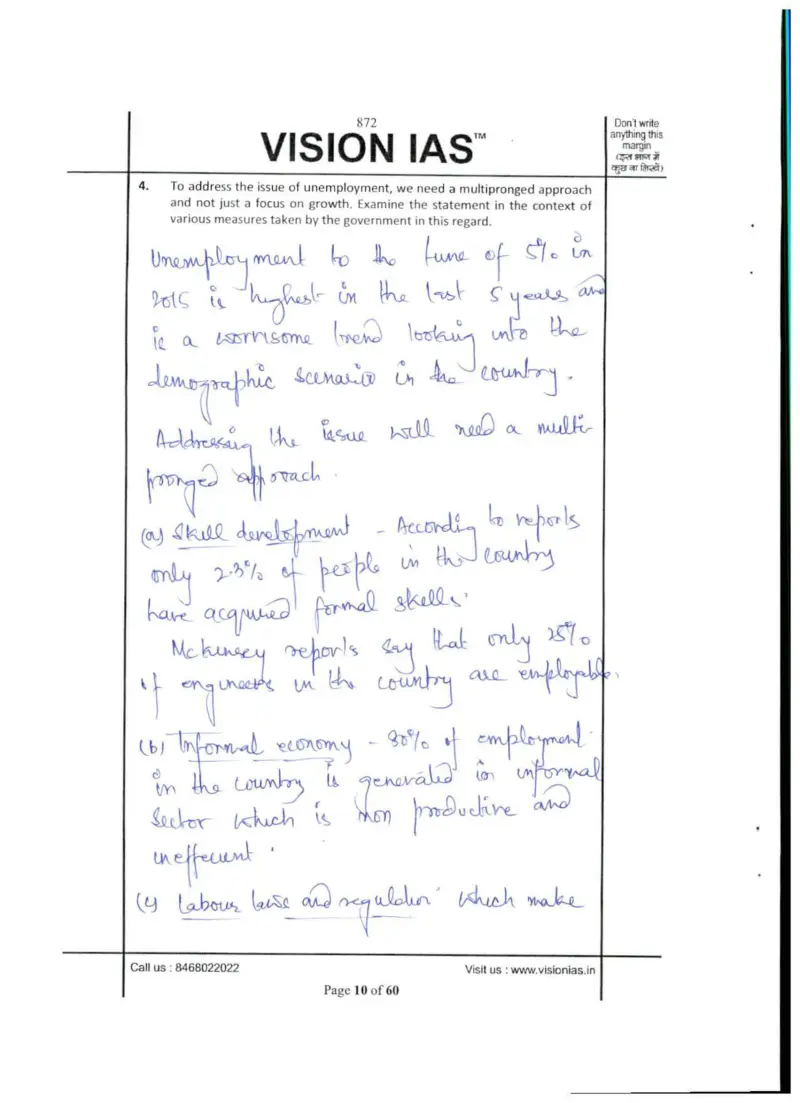
Answered a very similar question
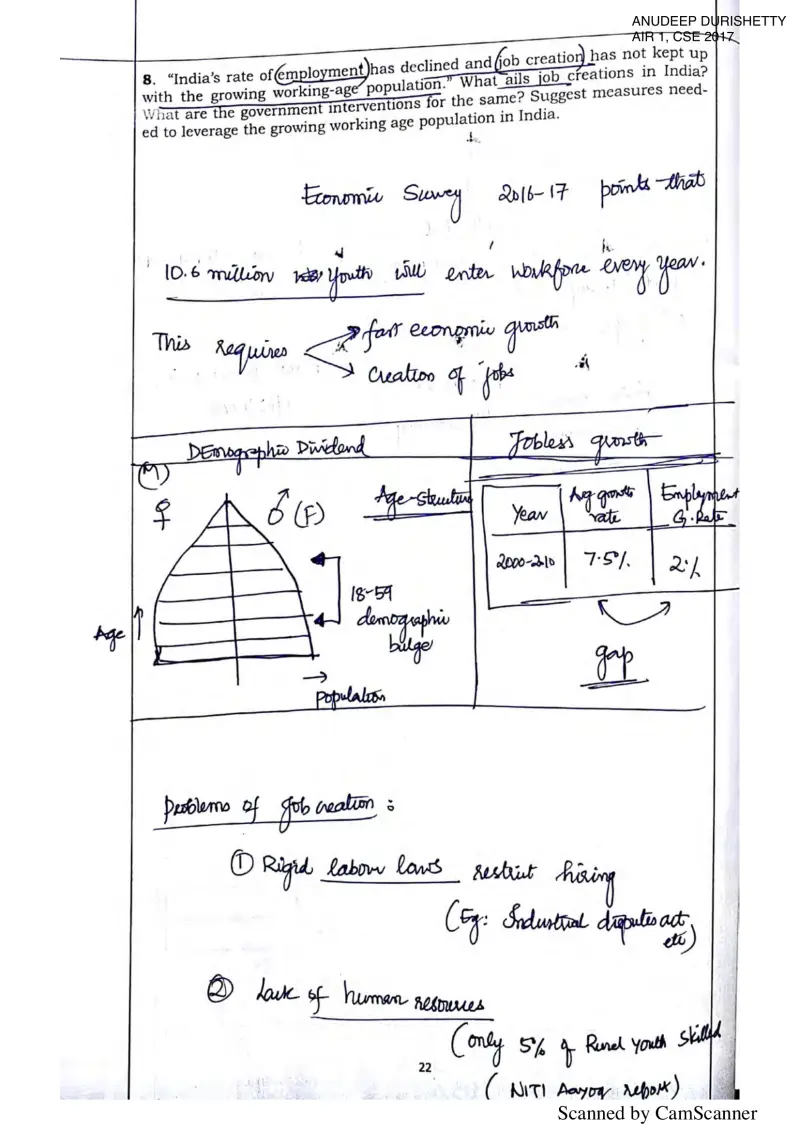
Their question: “Jobless growth, demographic dividend, what ails job creation, govt interventions”
Anudeep's Q8 marshals data showing growth without matching job creation and the interventions to fix it, precisely 2015 Q1's 'is Indian growth jobless' demand.
Key learnings from their answer
- ›He anchors claims in specific named data and reports rather than adjectives, R&D spend 'India 0.7% vs China 1.7% vs S Korea 3%' (NITI Aayog, Q11), 'roads = 2% of network but 40% of goods' (Q15), Economic Survey '10.6 million youth enter workforce every year' (Q4/Q8), EoDB rank '130/189' (Q8), ISA solar '175 W/m²' (Q6). -> Replace vague phrases like 'low spending' or 'huge workforce' with a sourced figure; one precise comparative statistic per argument lifts an answer from generic to authoritative.
- ›He names committees, acts and landmark cases with precision instead of generalities, Ashok Dalwai committee and 'double farm income by 2022-23' (Q1/Q16), Xaxa committee and the Vedanta/Dongria Kondh case alongside PESA, FRA, SAMADHAN and UAPA (Q14). -> Build a stock of the exact committee/act/case attached to each GS3 theme and deploy it as evidence; specific institutional references demonstrate you've engaged the syllabus, not just opinions.
What they cited: Q8: Economic Survey 2016-17; Industrial Disputes Act; NITI Aayog report (only ~5% of rural youth skilled); World Bank EoDB ranking India 130/189; Amartya Sen (poor health & education -> poor employment); Make in India (100 million jobs by 2022); abolition of FIPB; Startup India, Stand-up India; Skill India Mission (skill 40 cr); IPR policy; Mudra Bank; Insolvency & Bankruptcy Code; ICDS, RTE; GDP growth 7.5% vs employment growth 2% (2000-2010)