
Study the given table and answer the question that follows. The given table shows the production of T-shirts by four companies i.e., C1, C2, C3 and C4 over the four years. Which company had the maximum average production of T-shirts during these four years?
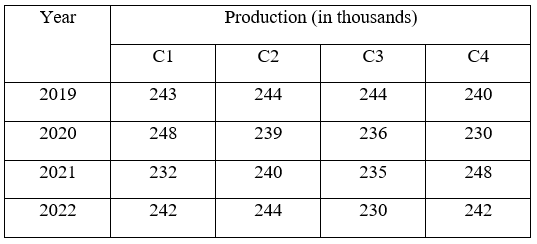
- (a)C4
- (b)C1
- (c)C2
- (d)C3
Answer
Why
Correct — C. Every company is measured over the same four years, so the largest average is simply the largest four-year total. No division is needed to rank them.
C1: 243 + 248 + 232 + 242 = 965
C2: 244 + 239 + 240 + 244 = 967
C3: 244 + 236 + 235 + 230 = 945
C4: 240 + 230 + 248 + 242 = 960
967 is the highest total, so C2 has the maximum average: 967/4 = 241.75 thousand T-shirts → option (c).
Why the others are wrong
- (a)C4 — C4 totals 960 thousand, an average of 240. Its 248 in 2021 ties for the table's highest single entry, but its 230 in 2020 hands that lead straight back.
- (b)C1 — C1 totals 965 thousand, average 241.25 — the closest rival, and just 2 thousand behind C2 across the whole four years. Eyeballing the rows instead of adding them lands here.
- (d)C3 — C3 totals 945 thousand, average 236.25 — the lowest of the four. It shares the top figure in 2019 at 244 and then falls in every following year, ending at 230.
Concept
Average = total ÷ number of observations. When each option is averaged over the same number of periods, that divisor is common to all of them, so ranking the totals ranks the averages.
Four additions therefore settle the question and the division is only needed if the value itself is asked for. This shortcut fails the moment the periods differ between rows.
The table is an image. Production in thousands, read column by column:
2019 — C1 243, C2 244, C3 244, C4 240
2020 — C1 248, C2 239, C3 236, C4 230
2021 — C1 232, C2 240, C3 235, C4 248
2022 — C1 242, C2 244, C3 230, C4 242
Key facts
- A divisor shared by every option cannot change the ranking, so totals rank averages.
- C2's four-year total is 967 thousand, the highest, giving an average of 241.75 thousand.
- The four totals span only 22 thousand, from C3's 945 to C2's 967, so estimating is unsafe.
Study next
Common traps
- Dividing all four totals by 4 before comparing, spending time and inviting slips for nothing.
- Slipping a column: C1 and C2 are adjacent and their totals differ by only 2 thousand.
- Choosing the company with the single best year rather than the best four-year record.
Tier-I tabular DI works a small grid for an average, a total, a ratio or a percentage change. This shift's Quant Q.4 does the same job from a graph, asking for a percentage instead of an average.
Related PYQs
No directly related past PYQ was found.