
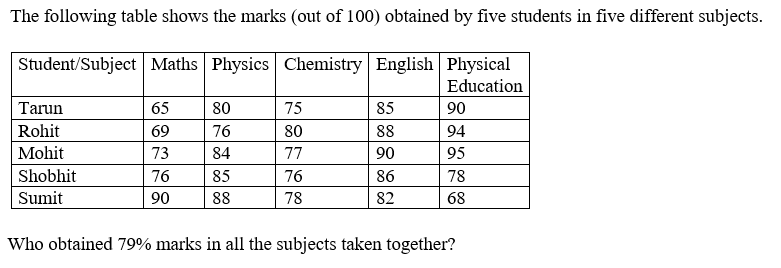
The following table shows the marks (out of 100) obtained by five students in five different subjects. Student/Subject — Maths | Physics | Chemistry | English | Physical Education Tarun — 65 | 80 | 75 | 85 | 90 Rohit — 69 | 76 | 80 | 88 | 94 Mohit — 73 | 84 | 77 | 90 | 95 Shobhit — 76 | 85 | 76 | 86 | 78 Sumit — 90 | 88 | 78 | 82 | 68 Who obtained 79% marks in all the subjects taken together?
- (a)Rohit
- (b)Tarun
- (c)Mohit
- (d)Sumit
Answer
Why
Correct — B. Five subjects out of 100 each make a total out of 500, so 79% is 0.79 × 500 = 395 marks.
Add each row and compare with 395.
Tarun 65 + 80 + 75 + 85 + 90 = 395
Rohit 69 + 76 + 80 + 88 + 94 = 407
Mohit 73 + 84 + 77 + 90 + 95 = 419
Shobhit 76 + 85 + 76 + 86 + 78 = 401
Sumit 90 + 88 + 78 + 82 + 68 = 406
Only Tarun reaches 395, and 395 ⁄ 500 = 79% — option (b).
Why the others are wrong
- (a)Rohit — Rohit totals 407, which is 81.4%. His 94 in Physical Education is the second highest in that column and lifts him past 79%.
- (c)Mohit — Mohit totals 419, the highest in the table, for 83.8%. He is the top scorer overall, not the 79% one.
- (d)Sumit — Sumit totals 406, or 81.2%. His 90 in Maths is the best in that column, but his 68 in Physical Education is the worst, and the two roughly cancel.
Concept
A percentage question on a marks table is two steps: fix the denominator, then add.
Five subjects of 100 marks each put every student out of 500, so a target percentage becomes a target total — 79% is 395 marks — and the search reduces to one scan of the row sums.
Converting each student's total into a percentage separately is five divisions where a single multiplication would do.
Every subject here carries the same maximum of 100, which is why the row totals can be compared directly. Where the maxima differ, as in the History-Geography-Botany table at Quant Q.6 of this shift, raw totals stop being comparable.
Key facts
- Five papers of 100 marks each give a maximum of 500.
- 79% of 500 is 395 marks.
- Tarun's row of 65, 80, 75, 85 and 90 sums to exactly 395.
Study next
Common traps
- Averaging the five subject percentages, which works here only because every maximum is 100
- Adding four columns instead of five, since the Physical Education header wraps onto two lines and is easy to skip
One table feeds several questions, each asking for a different row statistic. The companion table item in this shift is Quant Q.6, whose cells are percentages rather than marks — the opposite trap.
Related PYQs
No directly related past PYQ was found.