
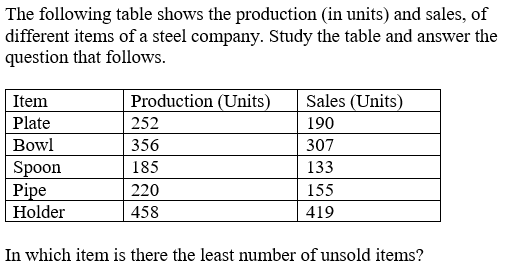
The following table shows the production (in units) and sales, of different items of a steel company. Study the table and answer the question that follows. Item → Production (Units) | Sales (Units) Plate — 252 | 190 Bowl — 356 | 307 Spoon — 185 | 133 Pipe — 220 | 155 Holder — 458 | 419 In which item is there the least number of unsold items?
- (a)Plate
- (b)Holder
- (c)Spoon
- (d)Pipe
Answer
Why
Correct — B. The stem is a table of production and sales for a steel company. Unsold = production − sales, row by row.
Plate: 252 − 190 = 62
Spoon: 185 − 133 = 52
Pipe: 220 − 155 = 65
Holder: 458 − 419 = 39
The smallest of those four differences is 39, so the least unsold stock is in Holder → option (b).
Why the others are wrong
- (a)Plate — Plate leaves 62 unsold, from 252 produced and 190 sold. Only Pipe does worse among the four choices, so Plate is nowhere near the least.
- (c)Spoon — Spoon leaves 52 unsold, from 185 produced and 133 sold. Spoon has the smallest production and the smallest sales in the whole table, which draws the eye, but the question asks for the smallest difference.
- (d)Pipe — Pipe leaves 65 unsold, from 220 produced and 155 sold — the largest shortfall of any row in the table. It is the exact opposite of what was asked.
Concept
Unsold stock is a column the table does not print. You build it yourself: production − sales, one subtraction per row, then compare.
Across the five rows the differences are Plate 62, Bowl 49, Spoon 52, Pipe 65 and Holder 39, so Holder is the least.
Notice that the biggest producer here also carries the smallest leftover. Absolute output and absolute surplus are unrelated quantities, and the option list is built on the assumption that you will conflate them.
Bowl is in the table with 356 produced and 307 sold, a gap of 49, but it is not among the four choices — that row is there to be read past.
A percentage version of the same question would still name Holder: 39 of 458 is about 8.5%, the smallest ratio in the table. Absolute and relative answers need not agree, so check rather than assume.
Key facts
- Unsold stock is production minus sales, a column this table does not print.
- Holder has both the highest production in the table, 458, and the lowest unsold count, 39.
- Pipe carries the largest unsold count in the table, 65 out of 220 produced.
Study next
Common traps
- Picking the row with the smallest production rather than the smallest difference.
- Choosing Bowl, which has the second-smallest gap in the table but is not offered as an option.
- Subtracting sales from production in the wrong order and then comparing negative numbers.
SSC prints a five-row production-and-sales table as an image and asks for a single derived extreme, here the least.
Another table-reading item sits at Quant Q.19 of this shift, where the derived column is disqualified applicants.
Related PYQs
No directly related past PYQ was found.