
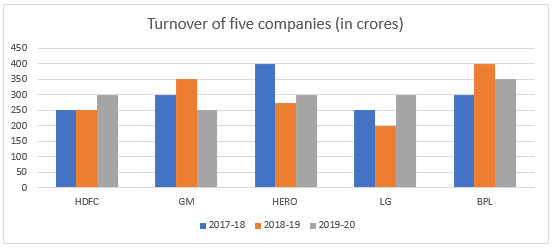
The given bar graph shows the turnover of five companies (in crores). What is the difference between the average sales turnover of all the companies put together between the years 2018-2019 and 2019-2020?.
- (a)₹2 crore
- (b)₹5 crore
- (c)₹6.5 crore
- (d)₹3.5 crore
Answer
Why
Correct — B. Read the five bars for each year off the graph, in crores. HERO's 2018-19 bar is the reading that does not land on a gridline — it stops midway between 250 and 300, at 275.
2018-19 (orange): 250, 350, 275, 200, 400 → total 1,475, average 295
2019-20 (grey): 300, 250, 300, 300, 350 → total 1,500, average 300
Difference = 300 − 295 = ₹5 crore → option (b)
Why the others are wrong
- (a)₹2 crore — ₹2 crore would need the two year-totals to differ by ₹10 crore. Every bar here is a multiple of 25, so the totals differ by a multiple of 25 and the averages by a multiple of 5 — 2 is not one.
- (c)₹6.5 crore — ₹6.5 crore would need a ₹32.5 crore gap between the year-totals, which bars read in multiples of 25 cannot produce.
- (d)₹3.5 crore — ₹3.5 crore implies a ₹17.5 crore gap, again not a multiple of 25. Snapping HERO's 2018-19 bar down to 250 moves the average by 5, not by the 1.5 this option needs.
Concept
A bar-graph average is two readings and one subtraction, and nearly all the risk sits in the readings.
The chart is gridded every 50 crore, so a bar top that lands between lines must be read as the midpoint — HERO's 2018-19 bar sits halfway between 250 and 300, so it is 275.
Because both years cover the same five companies, the averages can be skipped: the difference of the averages is the difference of the totals ÷ 5, here 25 ÷ 5 = 5.
Every bar on this chart is a multiple of 25, so both year-totals are multiples of 25 and any difference of averages must be a multiple of 5. That alone rules out ₹2 crore, ₹6.5 crore and ₹3.5 crore before a single sum.
Key facts
- The 2018-19 bars read 250, 350, 275, 200 and 400, totalling 1,475 crore.
- The 2019-20 bars read 300, 250, 300, 300 and 350, totalling 1,500 crore.
- For groups of equal size, the difference of the averages equals the difference of the totals divided by the group size.
- The chart's 2017-18 bars also total 1,500 crore, so 2017-18 and 2019-20 average the same.
Study next
Common traps
- Snapping HERO's 2018-19 bar down to the 250 gridline, which drags the average to 290.
- Comparing the wrong pair of years — the stem names 2018-2019 and 2019-2020, not 2017-2018.
- Skipping a company and then still dividing by five.
SSC reprints a chart with its option order shuffled: this same graph and this same stem appear at 13 Sep 2024, 09:00, Quant Q.16, where ₹5 crore is printed as option (a) rather than (b).
Averages off a bar chart also run at 23 Sep 2024, 09:00, Quant Q.25.
Related PYQs
No directly related past PYQ was found.