
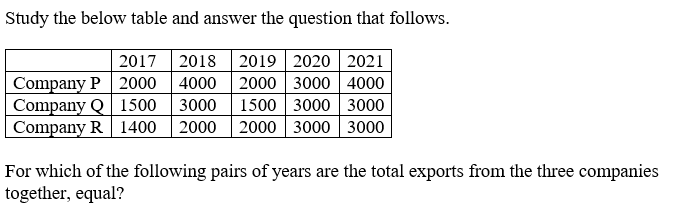
Study the below table and answer the question that follows. 2017 | 2018 | 2019 | 2020 | 2021 Company P — 2000 | 4000 | 2000 | 3000 | 4000 Company Q — 1500 | 3000 | 1500 | 3000 | 3000 Company R — 1400 | 2000 | 2000 | 3000 | 3000 For which of the following pairs of years are the total exports from the three companies together, equal?
- (a)2018 and 2019
- (b)2017 and 2018
- (c)2018 and 2020
- (d)2020 and 2021
Answer
Why
Correct — C. Add each year down its own column, across all three companies.
2017: 2000 + 1500 + 1400 = 4900
2018: 4000 + 3000 + 2000 = 9000
2019: 2000 + 1500 + 2000 = 5500
2020: 3000 + 3000 + 3000 = 9000
2021: 4000 + 3000 + 3000 = 10000
Two columns match, 2018 and 2020, both at 9000 → option (c).
Why the others are wrong
- (a)2018 and 2019 — 2018 and 2019 are 9000 against 5500. Company P alone drops from 4000 to 2000 between them, and Q drops 3000 to 1500.
- (b)2017 and 2018 — 2017 and 2018 are 4900 against 9000, the widest gap in the table. 2017 is the only column that does not end in a round thousand, because R contributes 1400.
- (d)2020 and 2021 — 2020 and 2021 are the near miss: 9000 against 10000. Q and R hold at 3000 across both years, but P rises from 3000 to 4000.
Concept
Table DI of the simplest kind. The question compares totals for a year, so the reading direction is down a column, not along a company's row.
Nothing here needs an average or a percentage — five additions and one comparison finish it. The efficient order is to total every column the options name before testing any option, rather than re-adding the same column twice.
Because all four options are pairs of years, at least four of the five columns have to be added anyway, so totalling all five costs almost nothing.
The stem calls the numbers exports, while the table itself carries only the years and the company names. Reproduce the paper's wording; the arithmetic does not depend on it.
Key facts
- Column totals across P, Q and R are 4900, 9000, 5500, 9000 and 10000 for 2017 to 2021.
- P, Q and R each stand at 3000 in 2020, which is what makes that column a round 9000.
- 2018 reaches the same 9000 by an uneven split of 4000, 3000 and 2000.
- Company R's 1400 in 2017 is the only value in the table that is not a multiple of 500.
Study next
Common traps
- Adding along a company's row when the question asks about years.
- Stopping at the first pair that looks close, such as 2020 and 2021.
- Reading R's 2017 entry as 1500 and making the 2017 total a round 5000.
Compute all five column totals once and the equality question falls out. A table of the same layout carries a combined-average comparison on 18 Sep 2024, 16:00, Quant Q.1, where company D's average is set against the combined average of A, B and C.
Related PYQs
No directly related past PYQ was found.