
Study the given table and answer the question that follows. The following table shows the percentage distribution of students in four different schools during the years 2021-22. If there was a total number of 16,000 and 18,000 students during the years 2021 and 2022 respectively, then the difference in number of students in school 4 in 2022 with respect to 2021 is:
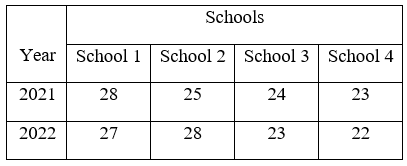
- (a)380
- (b)180
- (c)240
- (d)280
Answer
Why
Correct — D. Read the School 4 column of the table: 23% in 2021 and 22% in 2022.
2021: 23% of 16,000 = 16,000 × 23⁄100 = 3,680 students
2022: 22% of 18,000 = 18,000 × 22⁄100 = 3,960 students
Difference = 3,960 − 3,680 = 280 → option (d).
Why the others are wrong
- (a)380 — 380 is School 1's change, not School 4's: 27% of 18,000 = 4,860 against 28% of 16,000 = 4,480. Check the column heading before subtracting.
- (b)180 — 180 takes the one percentage-point drop and applies it to a single total, 1% of 18,000. The two years have different bases, so each has to be converted separately.
- (c)240 — 240 is not the School 4 gap. That column gives 3,680 students in 2021 and 3,960 in 2022, a difference fixed at 280.
Concept
A percentage-distribution table hides its bases. Each row's percentages are shares of that year's own total, so two figures in one column cannot be compared until both are turned into counts.
School 4's share falls from 23% to 22% and yet its headcount rises, because the total rises from 16,000 to 18,000. Convert first, subtract second.
The table is an image on the response sheet. Its School 4 column reads 23 for 2021 and 22 for 2022, while the totals of 16,000 and 18,000 come from the stem rather than the table.
Key facts
- In a percentage-distribution table each row's percentages are shares of that row's own total, not of a common base.
- School 4 loses one percentage point and still gains 280 students, because the base grows by 2,000.
- Both rows here total 100 — 28 + 25 + 24 + 23 for 2021 and 27 + 28 + 23 + 22 for 2022 — which is a quick check that the columns have been read correctly.
Study next
Common traps
- Applying the one percentage-point drop to a single total and answering 180.
- Sliding one column across and reading School 1, whose change is 380.
- Assuming a smaller percentage must mean fewer students.
Data interpretation also runs at Quant Q.12 of the same 26 Sep 2024, 09:00 sitting, where a five-school income table is read for a comparison between two income heads rather than for a headcount.
Related PYQs
No directly related past PYQ was found.