
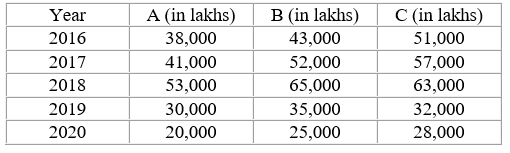
The below table shows the number of 1 litre bottles of soft drink produced by three companies during 2016-2020. Study the given information carefully and answer the question that follows. What is the difference in average production of A and C during 2016-2018 (in lakhs)?
- (a)14,000
- (b)13,000
- (c)9500
- (d)7800
Answer
Why
Correct — B. Read only the 2016, 2017 and 2018 rows of the A and C columns, then average each.
A: 38,000 + 41,000 + 53,000 = 132,000, so the average is 44,000
C: 51,000 + 57,000 + 63,000 = 171,000, so the average is 57,000
Difference = 57,000 − 44,000 = 13,000 → option (b)
With the same three years on both sides you can average the yearly gaps instead: (51,000 − 38,000) + (57,000 − 41,000) + (63,000 − 53,000) = 39,000, and 39,000 ⁄ 3 = 13,000.
Why the others are wrong
- (a)14,000 — 14,000 would need the three-year totals to differ by 42,000. They differ by 171,000 − 132,000 = 39,000, which divides to 13,000.
- (c)9500 — 9,500 comes from the wrong window. Averaging all five years, 2016 to 2020, gives 46,200 for C against 36,400 for A, a difference of 9,800 — close to this option but still not it, and the stem names 2016–2018.
- (d)7800 — 7,800 would need a three-year gap of 23,400. The actual gap between the C and A totals is 39,000, so this understates it by a wide margin.
Concept
An average over a stated window is two steps: add the rows inside the window, divide by how many there are. The rows outside it are there to be left alone.
A averages 132,000 ⁄ 3 = 44,000 and C averages 171,000 ⁄ 3 = 57,000 over 2016–2018.
When both averages run over the same number of years, their difference equals the average of the year-by-year differences — 13,000, 16,000 and 10,000 average to 13,000. That shortcut fails the moment the two windows differ in length.
The table's own header reads in lakhs and the question repeats the unit, so 13,000 is quoted in the paper's units and needs no conversion.
The B column and the 2019 and 2020 rows are distractor material — nothing in the question uses them.
Key facts
- A's 2016–2018 figures are 38,000, 41,000 and 53,000, totalling 132,000 for an average of 44,000.
- C's figures for the same years are 51,000, 57,000 and 63,000, totalling 171,000 for an average of 57,000.
- The difference of the two averages is 13,000.
- Equal window lengths let you average the yearly gaps instead: (13,000 + 16,000 + 10,000) ⁄ 3 = 13,000.
Study next
Common traps
- Averaging over all five years when the question names 2016–2018.
- Reading the B column instead of C, since B sits between the two the question names.
- Dividing the 39,000 total gap by 2 rather than by 3.
SSC prints five years and asks about three, so the first mark is for reading the window. Averages from a table are also asked at 25 Sep 2024, 09:00, Quant Q.5 and at 09 Sep 2024, 16:00, Quant Q.11, and Quant Q.5 of this paper puts a ratio question on a table of the same shape.
Related PYQs
No directly related past PYQ was found.