
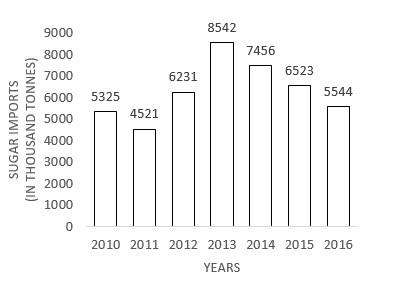
The given bar graph shows sugar imports of a country (in thousand tonnes) over the years. Study the graph and answer the question that follows. The average imports (in thousand tonnes) of all the years is:
- (a)6469
- (b)6603
- (c)6433
- (d)6306
Answer
Why
Correct — D. Read all seven bars, add them, divide by 7.
The values printed above the bars are 2010: 5325, 2011: 4521, 2012: 6231, 2013: 8542, 2014: 7456, 2015: 6523 and 2016: 5544.
5325 + 4521 = 9846
9846 + 6231 = 16077
16077 + 8542 = 24619
24619 + 7456 = 32075
32075 + 6523 = 38598
38598 + 5544 = 44142
44142 ⁄ 7 = 6306 exactly, so the average is 6306 thousand tonnes → option (d).
Why the others are wrong
- (a)6469 — 6469 is a six-bar figure: leave out 2010's 5325 and the rest total 38,817, averaging 6469.5. The graph runs 2010 to 2016 and the stem says all the years.
- (b)6603 — 6603 drops the shortest bar. Without 2011's 4521 the remaining six total 39,621 and average 6603.5 — close enough to tempt, but the divisor here is 7, not 6.
- (c)6433 — 6433 is exactly the average of 2010 to 2015, 38,598 ⁄ 6. It leaves out the last bar, 2016's 5544, which belongs in the sum.
Concept
An average from a bar graph is two operations and one reading task, and the marks go on the reading.
Count the bars before you divide. The stem asks for all the years, so the divisor is the number of bars on the axis — seven, running 2010 to 2016.
Add, then divide. The seven printed values total 44,142 thousand tonnes and 44,142 ⁄ 7 = 6306 with no remainder.
A clean division is a free check here: a remainder would mean a bar was mis-read or a digit carried wrong.
Every bar carries its value printed above it, so nothing has to be estimated against the axis — the 1000-unit grid is there only to make the shape readable.
The unit is thousand tonnes throughout, so the answer stays in thousand tonnes and no conversion is needed.
Key facts
- The seven bars read 5325, 4521, 6231, 8542, 7456, 6523 and 5544 thousand tonnes.
- Their total is 44,142 thousand tonnes.
- 44,142 ⁄ 7 = 6306, so the average import is 6306 thousand tonnes.
- 2013 is the peak year at 8542 and 2011 the lowest at 4521.
Study next
Common traps
- Dividing by six because one bar was missed in the addition
- Averaging only the years the eye is drawn to, the tallest and the shortest
- Carrying a digit wrong across a seven-term sum, which the exact division by 7 would expose
Every bar value is printed, so the item is an addition test dressed as data interpretation, and the phrase all the years fixes the divisor.
Bar-graph averages are also asked at 13 Sep 2024, 09:00, Quant Q.16 (difference between two years' average turnover) and at 23 Sep 2024, 09:00, Quant Q.25 (average attendance over three named days).
Related PYQs
No directly related past PYQ was found.