
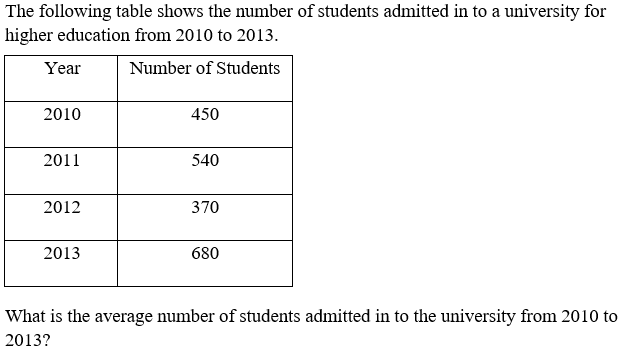
The following table shows the number of students admitted in to a university for higher education from 2010 to 2013. Year → Number of Students 2010 — 450 2011 — 540 2012 — 370 2013 — 680 What is the average number of students admitted in to the university from 2010 to 2013?
- (a)495
- (b)499
- (c)522
- (d)510
Answer
Why
Correct — D. The table gives admissions of 450 (2010), 540 (2011), 370 (2012) and 680 (2013). Add the four, then divide by 4.
450 + 540 = 990
990 + 370 = 1,360
1,360 + 680 = 2,040
2,040 ÷ 4 = 510 → option (d)
"From 2010 to 2013" is four years, not three — the table prints a row for each of them.
Why the others are wrong
- (a)495 — 495 is what 450 and 540 average to on their own. Across all four years the total is 2,040, and 495 would need a total of only 1,980.
- (b)499 — 499 corresponds to a four-year total of 1,996, which is 44 short of the 2,040 the table actually gives. Re-add the column.
- (c)522 — 522 corresponds to a total of 2,088, 48 more than the table's 2,040. A carry slipped somewhere in the addition.
Concept
The arithmetic mean is total ÷ count, and in a table question both halves come off the page: the total from the column, the count from the number of rows.
The count is where this item bites. "From 2010 to 2013" spans four listed years, even though the difference between the two years is three.
The mean does not have to match any row. Here 510 sits between 2011's 540 and 2010's 450 and equals none of the four entries, which is normal and not a sign of error.
Dividing by 3 instead of 4 gives 2,040 ÷ 3 = 680 — the 2013 figure exactly. Seeing a number you have already read in the table come out as the answer is a warning, not a confirmation.
Key facts
- The table lists 450 students in 2010, 540 in 2011, 370 in 2012 and 680 in 2013.
- Those four entries total 2,040.
- 2,040 ÷ 4 = 510, the average admission over the period.
- An inclusive range from 2010 to 2013 counts four years, not the three of 2013 − 2010.
Study next
Common traps
- Dividing by 3 because 2013 − 2010 = 3, which returns 680.
- Adding the column in one pass without a check — 450 + 540 + 370 + 680 = 2,040.
- Reading the average as the middle value of the four figures rather than the total over the count.
Here the table has four rows and one statistic is asked, so the marks go to careful addition rather than to method. Averages also carry Quant Q.1 of this paper, where a seventh member's age is defined against the team average, and Quant Q.10, where two unequal groups merge into a class average.
Related PYQs
No directly related past PYQ was found.