
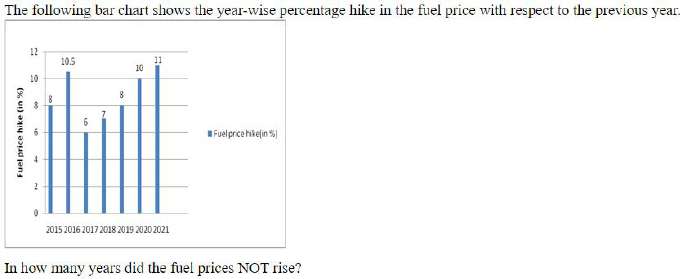
The following bar chart shows the year-wise percentage hike in the fuel price with respect to the previous year. Fuel price hike (in %) 2015 — 8 2016 — 10.5 2017 — 6 2018 — 7 2019 — 8 2020 — 10 2021 — 11 In how many years did the fuel prices NOT rise?
- (a)1
- (b)5
- (c)2
- (d)0
Answer
Why
Correct — D. The bar chart plots the percentage hike in the fuel price with respect to the previous year — a rate of change, not the price itself.
The seven bars read: 2015 = 8, 2016 = 10.5, 2017 = 6, 2018 = 7, 2019 = 8, 2020 = 10, 2021 = 11.
Every one of those is positive, so the price went up in each of the seven years.
Years in which the price did not rise = 0 → option (d).
Why the others are wrong
- (a)1 — 1 counts 2017, where the bar falls from 10.5 to 6. What dropped is the rate of increase — a 6% hike is still a hike.
- (b)5 — 5 would need five of the seven bars to be zero or negative. None is: even the shortest bar, 2017, stands at 6%.
- (c)2 — 2 counts the two shortest bars, 2017 at 6 and 2018 at 7, as flat years. Both are positive hikes, so the price rose in both.
Concept
This is a chart of change, not of level, and the two behave differently.
A price rises in any year whose bar is above zero. It falls only if a bar goes below zero, and it stands still only at exactly zero.
A bar shorter than last year's — 2017 after 2016 here — means the price climbed more slowly, from a base that was already higher. Read against zero, not against the neighbouring bar.
The chart is an image printed with the stem; its bar labels are 8, 10.5, 6, 7, 8, 10 and 11 for the years 2015 to 2021.
Key facts
- The bars show the percentage hike over the previous year, so the price level rises whenever a bar is above zero.
- A shorter bar than the year before means slower growth, not a price cut.
- The chart runs from 2015 to 2021 and its smallest bar is 2017 at 6%.
Study next
Common traps
- Reading the dip at 2017 as a fall in the fuel price.
- Comparing each bar with the neighbouring bar instead of with zero.
- Answering how many years the hike shrank rather than how many had no rise.
Counting items on data interpretation test a comparison rather than arithmetic.
A bar graph asked 10 Sep 2024, 12:30, Quant Q.22 wants the number of years in which production beat the average production, and is answered the same way — by testing each bar against one line.
Related PYQs
No directly related past PYQ was found.