
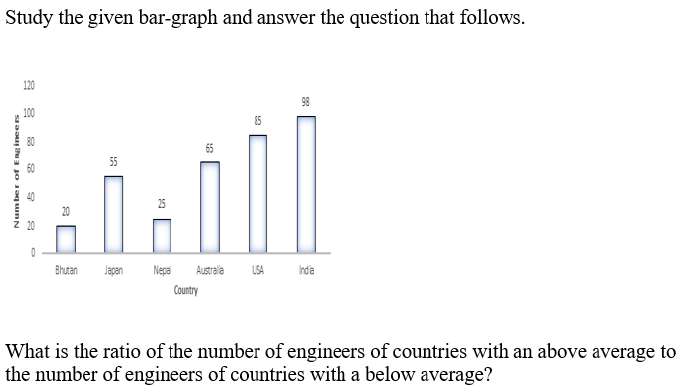
Study the given bar-graph and answer the question that follows. Number of Engineers → Country Bhutan — 20 | Japan — 55 | Nepal — 25 | Australia — 65 | USA — 85 | India — 98 What is the ratio of the number of engineers of countries with an above average to the number of engineers of countries with a below average?
- (a)

- (b)

- (c)

- (d)

Answer
Why
Correct — C. The stem is an image: a bar graph of engineers by country. It asks for "the ratio of the number of engineers of countries with an above average to the number of engineers of countries with a below average".
SSC's key reads that as a count of the countries on each side of the average, and the working below follows the key. The note at the foot of this card records the gap.
Bars: Bhutan 20, Japan 55, Nepal 25, Australia 65, USA 85, India 98
Total = 348, so average = 348 ÷ 6 = 58
Above 58: Australia, USA, India → 3
Below 58: Bhutan, Japan, Nepal → 3
3 : 3 = 1 : 1, the ratio printed on option (c).
Why the others are wrong
- (a)Option (a) shows 62⁄25, the ratio of the engineer totals — 248 above the average against 100 below. SSC's key counts countries rather than engineers; the disputed-key note sets out the difference.
- (b)Option (b) shows 2 : 1, which would need four countries above the average and two below. An average of 58 splits the six bars evenly, three and three.
- (d)Option (d) shows 39⁄71. Neither number appears anywhere in the working — not in the counts (3 and 3), not in the group totals (248 and 100).
Concept
A bar graph with an 'average' in the question always runs in two stages. First compute the mean of every bar, then go back and classify each bar against it.
Here the mean is 58, and the only bar that needs care is Japan's 55 — close enough to 58 that a hurried eye puts it on the wrong side.
The second stage is where this item bites: the ratio can be taken over the number of countries or over the number of engineers, and the two give different answers.
The stem and all four options are printed as images, so the options read as fractions — 62⁄25, 2⁄1, 1⁄1 and 39⁄71 — rather than as ratios written with a colon.
Key facts
- The six bars read 20, 55, 25, 65, 85 and 98, totalling 348 engineers.
- The average is 58, so Australia, USA and India stand above it and Bhutan, Japan and Nepal below it.
- Summing the two groups gives 248 engineers above the average and 100 below, a ratio of 62 : 25.
Study next
Common traps
- Placing Japan's 55 above the average of 58
- Averaging only the bars you glanced at instead of all six
SSC pairs a bar graph with an average and asks how the bars split around it — also asked 10 Sep 2024, 12:30, Quant Q.22 (in how many of the given years was production above the average) and 13 Sep 2024, 09:00, Quant Q.16 (difference between two average turnovers).
Related PYQs
No directly related past PYQ was found.