
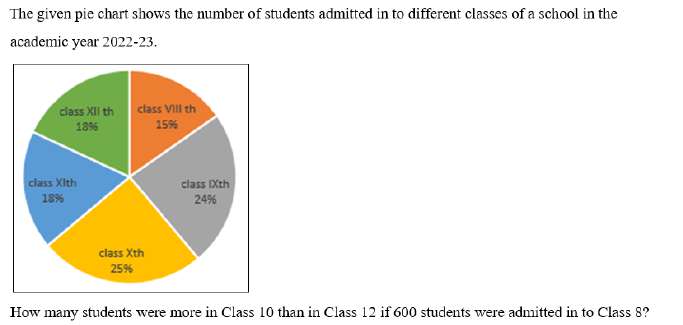
The given pie chart shows the number of students admitted in to different classes of a school in the academic year 2022-23. class VIII th — 15% class IXth — 24% class Xth — 25% class XIth — 18% class XII th — 18% How many students were more in Class 10 than in Class 12 if 600 students were admitted in to Class 8?
- (a)298
- (b)240
- (c)295
- (d)280
Answer
Why
Correct — D. In the pie chart Class 8 is the 15% slice, and it stands for 600 students, so find the whole first.
1 percentage point = 600 / 15 = 40 students
Total admitted = 40 × 100 = 4,000 students
Class 10 is the 25% slice: 25 × 40 = 1,000
Class 12 is the 18% slice: 18 × 40 = 720
Difference = 1,000 − 720 = 280 → option (d).
The same result comes straight from the gap in shares: (25 − 18) × 40 = 7 × 40 = 280.
Why the others are wrong
- (a)298 — 298 is not a multiple of 40. One percentage point is worth 40 students here, so every slice and every difference of slices is a multiple of 40 — this fails at sight.
- (b)240 — 240 is a gap of 6 percentage points, which is what you get by reading the 24% Class 9 slice in place of the 25% Class 10 slice. The chart gives 25% and 18%, a gap of 7 points.
- (c)295 — 295 fails the same multiple-of-40 test, and it sits close enough to 280 to catch a candidate who sizes the sectors by eye instead of using the printed 25% and 18%.
Concept
A pie chart gives shares, never counts. One printed count converts the whole chart: 15% is 600 students, so 1% = 40 students and the total is 4,000.
After that every slice is one multiplication. Class 10 at 25% is 1,000 students and Class 12 at 18% is 720.
When a difference is asked, subtract the shares first and convert once: (25 − 18) × 40 = 280. The five labels add to 15 + 24 + 25 + 18 + 18 = 100, a free check that no slice has been misread.
The chart labels the classes in Roman numerals (class VIII th, class IXth, class Xth, class XIth, class XII th) while the question asks about Class 10 and Class 12 in figures. Match the two before subtracting.
Key facts
- The chart shows class VIII 15%, class IX 24%, class X 25%, class XI 18% and class XII 18%.
- Those five shares total 100%, so the chart accounts for every admission.
- 600 students in the 15% slice fixes one percentage point at 40 students and the total at 4,000.
- Class X exceeds class XII by 7 percentage points, which is 280 students.
Study next
Common traps
- Treating the 600 as the total number admitted rather than as the Class 8 slice alone
- Subtracting the shares and answering 7 without converting to students
- Confusing class IXth at 24% with class Xth at 25%, which yields 240
SSC supplies one absolute figure against the chart and asks for another slice, a difference or a ratio.
The same conversion is asked 9 Sep 2024, 12:30, Quant Q.4, where a monthly income of ₹54,000 is set against a spending chart, and again 12 Sep 2024, 12:30, Quant Q.23, where 3 hours of English study fixes the hours of Mathematics.
Related PYQs
No directly related past PYQ was found.