
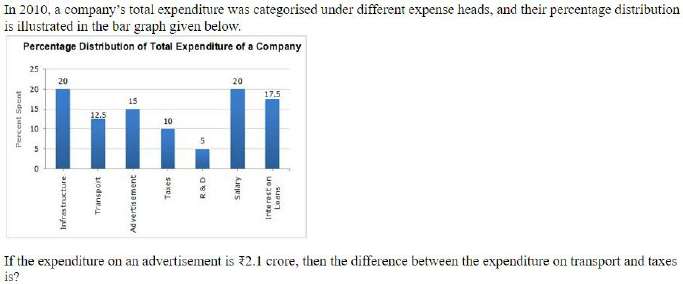
In 2010, a company’s total expenditure was categorised under different expense heads, and their percentage distribution is illustrated in the bar graph given below. Percentage Distribution of Total Expenditure of a Company Percent Spent Infrastructure — 20 Transport — 12.5 Advertisement — 15 Taxes — 10 R & D — 5 Salary — 20 Interest on Loans — 17.5 If the expenditure on an advertisement is ₹2.1 crore, then the difference between the expenditure on transport and taxes is?
- (a)₹32 lakh
- (b)₹42 lakh
- (c)₹35 lakh
- (d)₹30 lakh
Answer
Why
Correct — C. The bars are percentages of one total, so fix that total first.
Advertisement = 15% of the total = ₹2.1 crore
total = 2.1 × 100 ⁄ 15 = ₹14 crore
Transport is 12.5% and Taxes 10%, a gap of 2.5 percentage points.
2.5% of 14 crore = 14 × 2.5 ⁄ 100 = 0.35 crore
₹0.35 crore = ₹35 lakh → option (c)
Why the others are wrong
- (a)₹32 lakh — ₹32 lakh answers no gap on this graph. Transport 12.5% minus Taxes 10% is 2.5 percentage points, and 2.5% of ₹14 crore is ₹35 lakh.
- (b)₹42 lakh — ₹42 lakh is 3% of ₹14 crore — the gap you get by rounding the Transport bar to 13% instead of reading its printed label, 12.5.
- (d)₹30 lakh — ₹30 lakh is 2.5% of ₹12 crore. That total comes from anchoring on the wrong bar: ₹2.1 crore is the 15% Advertisement bar, not the 17.5% one.
Concept
A percentage chart carries no absolute values of its own. One anchor — here Advertisement = ₹2.1 crore against its 15% bar — converts every other bar into rupees.
Once the total is known, the difference between two heads is just the difference of their percentages applied to that total. You never need the two amounts separately.
The seven labelled bars add to 100 (20 + 12.5 + 15 + 10 + 5 + 20 + 17.5), the check that the graph really is a full distribution.
The graph is legible and every bar carries its own printed value, so nothing here depends on measuring bar heights against the axis.
The heads shown are Infrastructure 20, Transport 12.5, Advertisement 15, Taxes 10, R&D 5, Salary 20 and Interest on Loans 17.5.
Key facts
- Advertisement is 15% and equals ₹2.1 crore, so the company's total expenditure is ₹14 crore.
- Transport 12.5% and Taxes 10% differ by 2.5 percentage points, worth ₹35 lakh of ₹14 crore.
- 1 crore = 100 lakh, so ₹0.35 crore is ₹35 lakh.
Study next
Common traps
- Working out the two amounts separately and subtracting, which costs time and invites rounding slips
- Leaving the answer in crore when the options are printed in lakh
- Taking 2.5% of the ₹2.1 crore anchor instead of the ₹14 crore total
SSC anchors a chart with one absolute figure and then asks for a difference or a ratio.
The pie-chart form — one sector's rupee value given, every other sector read off the chart — is at 18 Sep 2024, 12:30, Quant Q.11, and a percentage-distribution table at 26 Sep 2024, 09:00, Quant Q.22.
Related PYQs
No directly related past PYQ was found.