
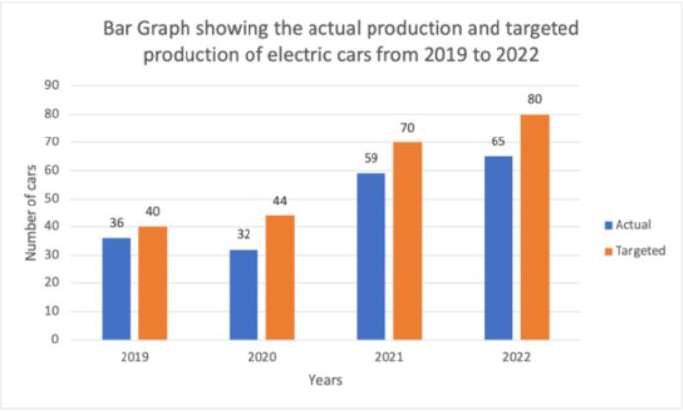
The given bar graph shows the actual production and targeted production of electric cars from 2019 to 2022. Study the given bar graph and answer the question that follows. What is the ratio of the total targeted production of cars in2021 and2022 tothe actual production of cars from 2019 to 2022 taken together?
- (a)25 : 36
- (b)36 : 25
- (c)25 : 32
- (d)32 : 25
Answer
Why
Correct — C.
Take the targeted (orange) bars for the two years the question names:
2021 = 70, 2022 = 80 → total = 150
Take the actual (blue) bars for all four years:
36 + 32 + 59 + 65 = 192
Form the ratio 150 : 192 and divide both by 6:
150 ÷ 6 = 25 and 192 ÷ 6 = 32
Ratio = 25 : 32 → option (c).
Why the others are wrong
- (a)25 : 36 — 25 : 36 keeps the correct 150 but needs the second total to be 216, since 25 × 216 = 36 × 150. The four blue bars sum to 36 + 32 + 59 + 65 = 192.
- (b)36 : 25 — 36 : 25 puts the bigger figure first. The targeted 2021–2022 total is 150 and the four-year actual total is 192, so the ratio asked for is less than 1.
- (d)32 : 25 — 32 : 25 is the keyed ratio inverted. It answers actual-to-targeted, whereas the stem puts the targeted total first and the actual total second.
Concept
Two-series bar graphs are read in three moves: legend, then years, then series.
The legend fixes the colours — blue is Actual, orange is Targeted. The stem then asks for different year spans on either side of the ratio, two years on top and four on the bottom, which is where most marks are lost.
After summing, reduce by the HCF. 150 and 192 share a factor of 6, giving 25 : 32, and 25 : 32 is already in lowest terms because 25 is 5² and 32 is 2⁵.
The stem's spacing is broken in the response sheet — it reads 'in2021 and2022 tothe actual production' — so read it slowly. It asks for targeted production over two years against actual production over four, not the same years on both sides.
Key facts
- Targeted production on the graph: 2019 = 40, 2020 = 44, 2021 = 70, 2022 = 80 (orange bars).
- Actual production on the graph: 2019 = 36, 2020 = 32, 2021 = 59, 2022 = 65 (blue bars).
- Targeted 2021 + 2022 = 150, actual 2019 to 2022 = 192, and 150 : 192 reduces by 6 to 25 : 32.
- Actual production dips once across the four years, from 36 in 2019 to 32 in 2020, then climbs to 59 and 65.
Study next
Common traps
- Summing all four targeted bars, 234, instead of only 2021 and 2022.
- Swapping the colours and totalling the blue bars for 2021 and 2022 (59 + 65 = 124).
- Writing the ratio the wrong way round and picking 32 : 25.
The reading matters more than the arithmetic here, because the two halves of the ratio run over different year lists.
The same mismatched-span structure appears on 09 Sep 2024, 12:30, Quant Q.20 (Institute B in 2019, 2020 and 2022 against Institute A in 2018, 2020 and 2021).
The same graph shape is worked other ways too: a combined average at 11 Sep 2024, 09:00, Quant Q.10 and a difference of averages at 13 Sep 2024, 09:00, Quant Q.16.
Related PYQs
No directly related past PYQ was found.