
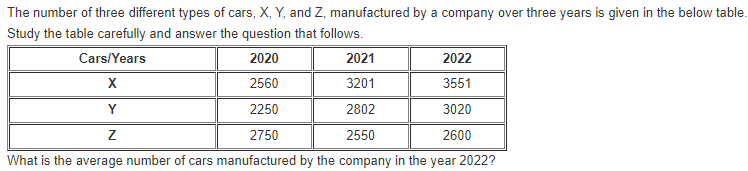
The number of three different types of cars, X, Y, and Z, manufactured by a company over three years is given in the below table. Study the table carefully and answer the question that follows. Cars/Years → 2020 | 2021 | 2022 X — 2560 | 3201 | 3551 Y — 2250 | 2802 | 3020 Z — 2750 | 2550 | 2600 What is the average number of cars manufactured by the company in the year 2022?
- (a)3227
- (b)2851
- (c)3057
- (d)2720
Answer
Why
Correct — C. The ask is the average across the three car types in one year, so read straight down the 2022 column. The 2020 and 2021 figures are there to be ignored.
2022 column: X = 3551, Y = 3020, Z = 2600
Add: 3551 + 3020 = 6571
6571 + 2600 = 9171
Divide by 3, the number of car types: 9171 ⁄ 3 = 3057 → option (c)
Why the others are wrong
- (a)3227 — 3227 would need the 2022 column to total 9,681. It totals 9,171. Re-add the column before dividing — that is where a 510 drift creeps in.
- (b)2851 — 2851 is the average of the 2021 column: 3201 + 2802 + 2550 = 8553, and 8553 ⁄ 3 = 2851. Right method, wrong column — one place to the left of the year named.
- (d)2720 — 2720 needs a column total of 8,160 against the actual 9,171. Nothing in 2022 supports a mean this low when the smallest entry is already 2600.
Concept
An average has two parts, and a table question is usually testing the second one: which numbers go on top, and how many go underneath.
Here the phrase 'in the year 2022' fixes the numerator as one column and the denominator as the count of car types in it, which is 3.
Change the wording to 'the average number of type X cars over the three years' and the same table gives (2560 + 3201 + 3551) ⁄ 3 — a row, not a column, and a different answer. The arithmetic is trivial; the reading is the question.
The stem prints a 3-row, 3-column table. Reading across, X is 2560, 3201, 3551; Y is 2250, 2802, 3020; Z is 2750, 2550, 2600, for the years 2020, 2021 and 2022.
Both the row count and the year count are 3, so the divisor is 3 whichever way you read it. That is exactly why a misread here is invisible in the final division.
Key facts
- The 2022 column reads X = 3551, Y = 3020, Z = 2600, which totals 9,171.
- The average of a set of numbers always lies between the smallest and the largest of them.
- The 2021 column averages 2,851, which is the value printed as option (b).
Study next
Common traps
- Averaging one car type across the three years instead of the three types in one year.
- Reading the 2021 column because it sits immediately beside 2022 in a narrow table.
- Adding all nine entries and still dividing by 3.
SSC prints a small manufacturing table and asks for a single average, so the whole item turns on which line you read down rather than on the arithmetic.
A table average is also asked at 18 Sep 2024, 16:00, Quant Q.1, where company D's average is compared with the combined average of A, B and C.
Related PYQs
No directly related past PYQ was found.