
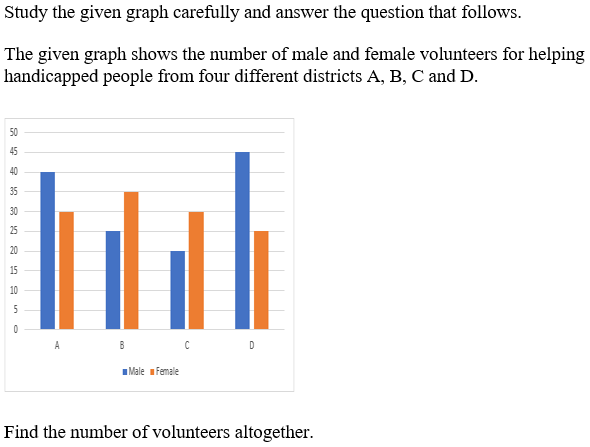
Study the given graph carefully and answer the question that follows. The given graph shows the number of male and female volunteers for helping handicapped people from four different districts A, B, C and D. District → Male | Female A — 40 | 30 B — 25 | 35 C — 20 | 30 D — 45 | 25 Find the number of volunteers altogether.
- (a)230
- (b)250
- (c)260
- (d)240
Answer
Why
Correct — B. "Altogether" means every bar on the chart — both series, all four districts.
Male bars: A 40, B 25, C 20, D 45
Male total = 40 + 25 + 20 + 45 = 130
Female bars: A 30, B 35, C 30, D 25
Female total = 30 + 35 + 30 + 25 = 120
Volunteers altogether = 130 + 120 = 250 → option (b).
Why the others are wrong
- (a)230 — 230 is 20 short — the size of district C's male bar, the shortest on the chart and the one most often skipped when the eye runs along the tops.
- (c)260 — 260 is 10 over: one bar read two gridlines too high — B's male 25 taken as 35, say. The axis steps in 5s, so a 10-volunteer slip is two gridlines wide.
- (d)240 — 240 is 10 short, the mirror slip: B's female 35 read down to 25. Every bar here sits exactly on a gridline, so no value needs estimating.
Concept
This is a grouped bar chart: two series, male and female, plotted side by side for each of four districts.
A grand total needs both series. The safe method is to total one series, total the other, then add — not to run down the chart adding pairs, where a single missed bar disappears silently.
Read the axis before the bars. It runs 0 to 50 with a gridline every 5, and every one of the eight bars lands on a gridline, so nothing here is a judgement call.
The stem, the chart and the question arrive as one image, so the eight bar values are set out in the working above. The chart's own caption calls them volunteers "for helping handicapped people" from four districts A, B, C and D.
Key facts
- Male volunteers by district: A 40, B 25, C 20, D 45, totalling 130.
- Female volunteers by district: A 30, B 35, C 30, D 25, totalling 120.
- Districts A and D are male-majority, while B and C are female-majority.
- Districts A and D tie on the two-bar total at 70 each, ahead of B on 60 and C on 50.
Study next
Common traps
- Adding a single series and answering 130 or 120
- Assuming the district with the tallest bar leads overall, when D only ties A at 70
- Reading a bar off the wrong gridline on an axis that steps in 5s
The same picture carries different questions across papers — a total, a ratio, an average, a percentage share.
Also asked 09 Sep 2024, 12:30, Quant Q.20 (ratio from a two-series bar graph of students in Institutes A and B) and 17 Sep 2024, 12:30, Quant Q.14 (actual against targeted production of electric cars).
Related PYQs
No directly related past PYQ was found.