
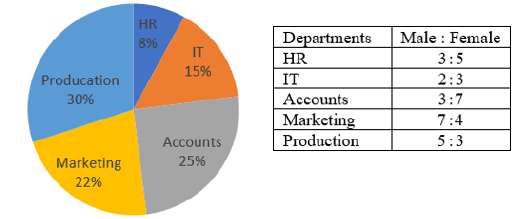
The following pie chart shows the percentage distribution of a total of 1600 employees in different departments of a company. The table shows the ratio of male to female employees in different departments. Study the information and answer the question that follows. What is the percentage of the number of employees in production department to the number of female employees of all the departments taken together? (correct to one decimal place)
- (a)64.3%
- (b)50.7%
- (c)44.9%
- (d)59.1%
Answer
Why
Correct — D. The total is 1600, so every pie slice converts straight into a head count, and the table then splits each count into men and women.
Numerator: Production = 30% of 1600 = 480.
Now the women, department by department.
HR 8% = 128, ratio 3 : 5 → 128 × 5⁄8 = 80
IT 15% = 240, ratio 2 : 3 → 240 × 3⁄5 = 144
Accounts 25% = 400, ratio 3 : 7 → 400 × 7⁄10 = 280
Marketing 22% = 352, ratio 7 : 4 → 352 × 4⁄11 = 128
Production 30% = 480, ratio 5 : 3 → 480 × 3⁄8 = 180
Total women = 80 + 144 + 280 + 128 + 180 = 812
480 ⁄ 812 × 100 = 59.11%, which is 59.1% to one decimal → option (d).
Why the others are wrong
- (a)64.3% — 64.3% would need the female total to be about 747. Adding the five department figures — 80, 144, 280, 128 and 180 — gives 812.
- (b)50.7% — 50.7% would need a female total near 947, more women than the ratios produce. Marketing is male-heavy at 7 : 4 and contributes only 128.
- (c)44.9% — 44.9% would need a female total above 1,000 out of a company of 1600, which the five ratios cannot reach. The true denominator is 812.
Concept
This is a two-source data set: the pie chart gives each department's share of 1600, and the table gives the male-to-female split inside each department. Neither alone answers the question.
The numerator is one department's headcount. The denominator is a sum across every department, so all five ratios must be applied before anything is divided.
For a ratio m : f, the female share of a department of size N is N × f ⁄ (m + f). The percentages here are chosen so each of those divisions is exact.
The pie chart's own label reads 'Producation'; the question text calls it the production department, and they are the same 30% slice.
Note also that the numerator counts all production employees, men included, while the denominator counts only women — the question is deliberately comparing unlike groups.
Key facts
- The slices are HR 8%, IT 15%, Accounts 25%, Marketing 22% and Production 30%, totalling 100%.
- On 1600 employees those slices are 128, 240, 400, 352 and 480.
- The female counts are 80, 144, 280, 128 and 180, summing to 812.
- 480 ⁄ 812 = 0.5911, so the answer is 59.1% to one decimal place.
Study next
Common traps
- Comparing production employees with production women only, instead of with all the women.
- Reading the table column as female : male when the header says Male : Female.
- Summing the male counts by habit, which gives 788 and 60.9%, matching no option.
This set pairs a percentage pie with a ratio table so that neither source alone is enough, and its denominator is a sum across every row rather than a single slice. A grouped bar-chart set sits just before it at Quant Q.7.
Related PYQs
No directly related past PYQ was found.