
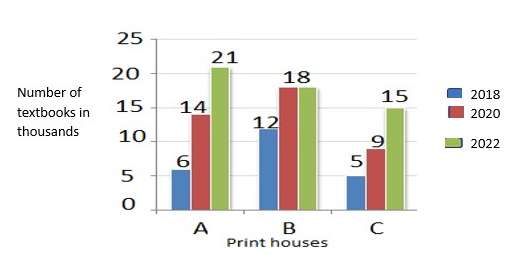
Study the given chart and answer the question that follows. The following chart shows the production of textbooks in thousands in the years 2018, 2020 and 2022 from the print houses A, B and C, respectively. The ratio of textbooks produced by Print house B in the year 2018 to the textbooks produced by Print house C in the year 2020 is ______.
- (a)4 : 5
- (b)3 : 4
- (c)4 : 3
- (d)2 : 3
Answer
Why
Correct — C. The chart is a grouped bar chart: three bars per print house, in the order 2018, 2020, 2022, with the value in thousands printed above the bar — on eight of the nine bars.
Print house B in 2018 = 12.
Print house C in 2020 = 9.
Ratio = 12 : 9
Divide both terms by the HCF, 3 → 4 : 3 → option (c).
The 'thousands' unit is common to both terms, so it cancels and never enters the arithmetic.
Why the others are wrong
- (a)4 : 5 — 4 : 5 is 12 : 15, which pairs B's 2018 bar with C's 2022 bar. The question names 2020 for print house C, and that bar reads 9.
- (b)3 : 4 — 3 : 4 is 4 : 3 inverted. Order matters in a ratio: the question puts B's 2018 figure first, so 12 belongs on top.
- (d)2 : 3 — 2 : 3 is 6 : 9 — A's 2018 bar read instead of B's. B's 2018 bar is the leftmost of its group and reads 12.
Concept
A grouped bar chart plots one bar per year inside each category, and the legend fixes which colour is which year. Here the categories are the three print houses and the groups run 2018, 2020, 2022 from left to right, with the value printed above most of the bars.
Eight of the nine bars carry a number: print house B's 2022 bar is the one left unlabelled. So the skill being tested is locating the right two bars. Once located, the ratio is ordinary reduction by the HCF.
Shared units — thousands here — cancel in a ratio and can be dropped at the start.
Note the years jump 2018, 2020, 2022, so there is no bar for 2019 or 2021 and no interpolation is invited. Reading the middle bar as 2019 is the fastest way to lose the mark.
Key facts
- Print house A produced 6, 14 and 21 thousand textbooks in 2018, 2020 and 2022.
- Print house B's 2018 and 2020 bars are labelled 12 and 18 thousand, while its 2022 bar carries no printed value and stands level with the 2020 bar.
- Print house C produced 5, 9 and 15 thousand across the same three years.
- 12 thousand : 9 thousand reduces to 4 : 3, since a shared unit cancels in a ratio.
Study next
Common traps
- Reversing the two terms and answering 3 : 4.
- Taking B and C in the same year, which would give 12 : 5 for 2018 or 18 : 9 for 2020.
- Trusting bar height where no number is printed: B's 2022 bar is the unlabelled one, and this question never needs it.
The two values this item needs are printed above their bars, so the arithmetic is trivial and the mark is won or lost in picking the right bar. A pie-chart-plus-ratio-table set follows at Quant Q.9.
Related PYQs
No directly related past PYQ was found.