
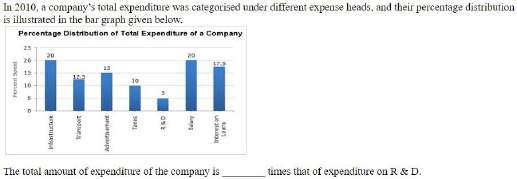
In 2010, a company’s total expenditure was categorised under different expense heads, and their percentage distribution is illustrated in the bar graph given below. Percentage Distribution of Total Expenditure of a Company Percent Spent Infrastructure — 20 Transport — 12.5 Advertisement — 15 Taxes — 10 R & D — 5 Salary — 20 Interest on Loans — 17.5 The total amount of expenditure of the company is ________ times that of expenditure on R & D.
- (a)20
- (b)38
- (c)32
- (d)28
Answer
Why
Correct — A. The bars are percentages of one company's expenditure, so the whole is 100.
The seven bars read: Infrastructure 20, Transport 12.5, Advertisement 15, Taxes 10, R & D 5, Salary 20, Interest on Loans 17.5
Add them: 20 + 12.5 + 15 + 10 + 5 + 20 + 17.5 = 100, so the graph is a full distribution and no rupee figure is needed.
Total ÷ R & D = 100 ÷ 5 = 20 → option (a)
Why the others are wrong
- (b)38 — 38 would need R & D to be 100 ÷ 38 ≈ 2.6% of the total. The R & D bar stands on the 5 gridline and is labelled 5.
- (c)32 — 32 would need the seven bars to total 160 with R & D still at 5. They total 100, which is the check that this is a percentage distribution.
- (d)28 — The comparison asked for is total against R & D, fixed by the graph at 100 against 5. An answer of 28 would put R & D at roughly 3.6%, not the 5 printed on the bar.
Concept
A percentage bar graph carries its own audit: the bars must add to 100. Adding them first costs a few seconds and tells you whether you are looking at a distribution of a whole or at a set of unrelated figures.
Once the whole is known to be 100 units, a how-many-times question is one division: total ÷ part. No rupee amount is required, and none is given.
The part here is R & D at 5, the shortest bar on the chart, so this comparison produces the largest multiple the chart can give.
The chart is a scan inside the response sheet and its labels are small. The seven values read 20, 12.5, 15, 10, 5, 20 and 17.5, and their total of exactly 100 is what confirms the reading is right.
Key facts
- In a percentage distribution the parts total 100, which doubles as a check on your reading.
- R & D is 5 percent of the total, so the total is 20 times the R & D spend.
- Infrastructure and Salary are the joint-largest heads on this chart at 20 percent each.
Study next
Common traps
- Comparing R & D with the other heads added up, 95 ÷ 5 = 19, instead of with the total.
- Treating the bars as rupee amounts and hunting for a total the question never gives.
- Misreading the 12.5 and 17.5 labels as 12 and 17, which breaks the total-of-100 check.
Data interpretation rewards reading accuracy more than arithmetic. This same paper puts a textbook-production bar chart at Quant Q.7 and a pie chart with a supporting ratio table at Quant Q.9, both of which reward the habit of totalling the figures before answering.
Related PYQs
No directly related past PYQ was found.