
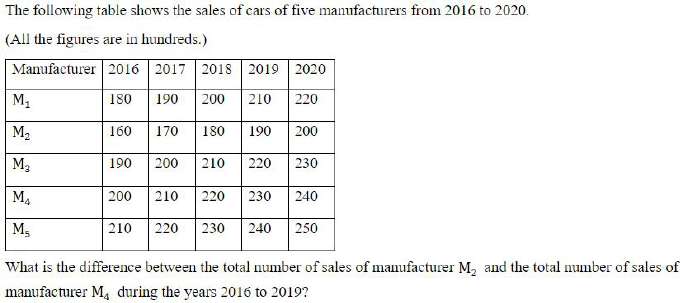
The following table shows the sales of cars of five manufacturers from 2016 to 2020. (All the figures are in hundreds.) Manufacturer → 2016 | 2017 | 2018 | 2019 | 2020 M₁ — 180 | 190 | 200 | 210 | 220 M₂ — 160 | 170 | 180 | 190 | 200 M₃ — 190 | 200 | 210 | 220 | 230 M₄ — 200 | 210 | 220 | 230 | 240 M₅ — 210 | 220 | 230 | 240 | 250 What is the difference between the total number of sales of manufacturer M₂ and the total number of sales of manufacturer M₄ during the years 2016 to 2019?
- (a)12000
- (b)16000
- (c)18000
- (d)14000
Answer
Why
Correct — B. The stem is a table image of car sales by five manufacturers, 2016 to 2020, with all figures in hundreds. The question asks about 2016 to 2019 only, so the 2020 column is not used.
M₂ across the four years, running total:
160 + 170 = 330
330 + 180 = 510
510 + 190 = 700
M₄ across the same four years:
200 + 210 = 410
410 + 220 = 630
630 + 230 = 860
Difference = 860 − 700 = 160
Figures are in hundreds: 160 × 100 = 16,000 → option (b).
Why the others are wrong
- (a)12000 — 12,000 is 120 hundreds, which is three years of the gap rather than four. M₄ leads M₂ by a flat 40 in every column, so four years give 160 hundreds.
- (c)18000 — 18,000 needs a gap of 180 hundreds. The M₂ and M₄ rows differ by exactly 40 in each of the five columns shown, so no four-year window can produce more than 160.
- (d)14000 — 14,000 is 140 hundreds — three and a half years of the constant 40. The window given is four whole years: 2016, 2017, 2018 and 2019.
Concept
Table-based data interpretation gives away almost all its marks on reading, not on arithmetic. Three things are worth checking before any addition.
First the unit note — here "all the figures are in hundreds", which multiplies your final answer by 100. Second the window — the table runs to 2020 but the question stops at 2019. Third the rows, since M₂ and M₄ are the second and fourth manufacturers, not columns.
Only then does the sum matter, and here it is four additions per row.
Both rows rise by a constant 10 each year, so the gap between them is a flat 40 in every column. That makes 4 × 40 = 160 a valid shortcut once you have noticed it.
Key facts
- The table's header states that all figures are in hundreds, so a row total of 700 means 70,000 cars.
- M₄ exceeds M₂ by exactly 40 in every one of the five years printed in this table.
- M₂ runs 160, 170, 180, 190, 200 and M₄ runs 200, 210, 220, 230, 240 — both rising by 10 a year.
Study next
Common traps
- Including the 2020 column because it is the last one in the table.
- Answering 160 and forgetting that the figures are in hundreds.
- Counting M₂ and M₄ as the second and fourth columns rather than rows.
The arithmetic is four additions. The difficulty SSC builds in is the reading — a year window narrower than the table, and a unit note sitting above it.
Related PYQs
No directly related past PYQ was found.