
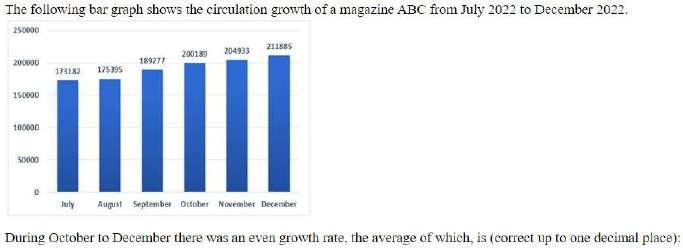
The following bar graph shows the circulation growth of a magazine ABC from July 2022 to December 2022. July — 173182 August — 175395 September — 189277 October — 200189 November — 204933 December — 211885 During October to December there was an even growth rate, the average of which, is (correct up to one decimal place):
- (a)3.2%
- (b)2.4%
- (c)3.8%
- (d)2.9%
Answer
Why
Correct — D. Take the two month-on-month growths that lie inside the October-to-December window and average them.
Bar values: Oct = 200189, Nov = 204933, Dec = 211885
Oct → Nov: 4744⁄200189 × 100 = 2.37%
Nov → Dec: 6952⁄204933 × 100 = 3.39%
Average = (2.37 + 3.39)⁄2 = 2.88% ≈ 2.9% → option (d)
Why the others are wrong
- (a)3.2% — 3.2% is not the midpoint of the two monthly rates. Those rates are 2.37% and 3.39%, and the mean of any two numbers sits centrally between them — here at 2.88%.
- (b)2.4% — 2.4% is the October → November growth on its own, 2.37% rounded. The November → December rise of 3.39% still has to be averaged in.
- (c)3.8% — 3.8% is the average once September is wrongly dragged in. September → October is 5.77%, and (5.77 + 2.37 + 3.39)⁄3 = 3.84%. The window starts at October.
Concept
A growth rate is measured against the earlier value, never the later one.
October → November uses 200189 as the base and November → December uses 204933. Shifting the base is what produces the near-miss answers in bar-graph DI.
'October to December' names two intervals, not three. October's own rise belongs to the September → October step and sits outside the window.
The paper's phrase is 'an even growth rate', which is loose English. The arithmetic the key rewards is the mean of the two month-on-month growth rates inside that window.
Key facts
- The bar labels read October 200189, November 204933 and December 211885.
- Growth rate = (rise ÷ earlier value) × 100, so the base changes every month.
- October → November is 2.37% and November → December is 3.39%.
Study next
Common traps
- Using the later month as the base, which gives 2.31% and 3.28%.
- Counting three growth steps in a window that contains only two.
- Averaging the circulation figures instead of the growth rates.
SSC gives one chart and then asks for a percentage inside a named window, so the marks turn on which two bars you use. Quant Q.17 of this same shift is the table version of the same read.
Related PYQs
No directly related past PYQ was found.