
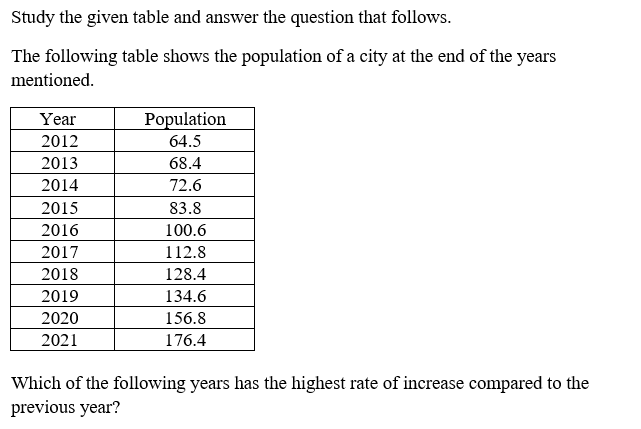
Study the given table and answer the question that follows. The following table shows the population of a city at the end of the years mentioned. Year → Population 2012 — 64.5 2013 — 68.4 2014 — 72.6 2015 — 83.8 2016 — 100.6 2017 — 112.8 2018 — 128.4 2019 — 134.6 2020 — 156.8 2021 — 176.4 Which of the following years has the highest rate of increase compared to the previous year?
- (a)2016
- (b)2015
- (c)2018
- (d)2019
Answer
Why
Correct — A. "Rate of increase" is the rise measured against the previous year's population, not the size of the rise.
2015: (83.8 − 72.6) ⁄ 72.6 = 11.2 ⁄ 72.6 = 15.43%
2016: (100.6 − 83.8) ⁄ 83.8 = 16.8 ⁄ 83.8 = 20.05%
2018: (128.4 − 112.8) ⁄ 112.8 = 15.6 ⁄ 112.8 = 13.83%
2019: (134.6 − 128.4) ⁄ 128.4 = 6.2 ⁄ 128.4 = 4.83%
The highest of the four is 2016 → option (a)
Why the others are wrong
- (b)2015 — 2015 does jump by 11.2, but on a base of 72.6 that is only 15.43%, below 2016's 20.05%. A rise is only as big as the number it is divided by.
- (c)2018 — 2018 adds 15.6, nearly as much as 2016's 16.8 — but the base has grown to 112.8 by then, so the rate falls to 13.83%.
- (d)2019 — 2019 adds just 6.2 on a base of 128.4, giving 4.83% — the lowest rate anywhere in this table. It is offered to catch anyone scanning the population column rather than the change.
Concept
Rate of increase for a year is (this year − previous year) ⁄ previous year × 100. The base is last year's figure, and it changes every row.
That is why absolute rises mislead. As the population grows, the same increment buys a smaller percentage, so the biggest jump and the fastest growth are usually different years.
In this table 2020 has the largest rise of all — 22.2 — yet its rate is 16.49%, still under 2016's 20.05%.
Only four years are offered, so you need four divisions, not nine. Compute the rates only for the years the options name.
Key facts
- Rate of increase = (this year − previous year) ⁄ previous year × 100.
- 2016 grows 20.05%, the highest single-year rate in this table.
- 2019 grows 4.83%, the lowest rate in this table.
- 2020 has the largest absolute rise (22.2) but a rate of only 16.49%.
Study next
Common traps
- Choosing the year with the biggest jump in population rather than the biggest jump relative to its base
- Dividing by the current year's population instead of the previous year's
- Comparing 2016 and 2020 by eye because 22.2 looks larger than 16.8
SSC gives a ten-row table and then narrows it to four candidate years, so the work is deliberately small and the reading is the test. The same shift applies the same select-the-right-rows discipline to an income table at Quant Q.1.
Related PYQs
No directly related past PYQ was found.