
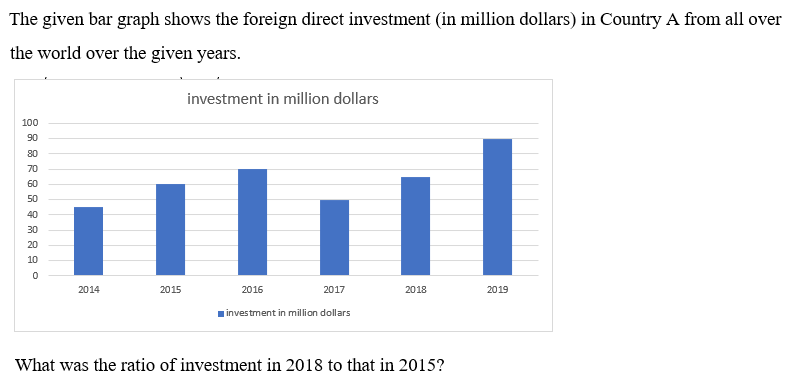
The given bar graph shows the foreign direct investment (in million dollars) in Country A from all over the world over the given years. investment in million dollars 2014 — 45 | 2015 — 60 | 2016 — 70 | 2017 — 50 | 2018 — 65 | 2019 — 90 What was the ratio of investment in 2018 to that in 2015?
- (a)11 : 12
- (b)13 : 12
- (c)12 : 11
- (d)13 : 11
Answer
Why
Correct — B. The image is a bar graph of foreign direct investment in Country A, in million dollars, one bar for each year from 2014 to 2019. It asks for the ratio of investment in 2018 to that in 2015.
The 2015 bar sits on the 60 gridline.
The 2018 bar stands midway between the 60 and 70 gridlines, so 65.
2018 : 2015 = 65 : 60
Divide both terms by 5 = 13 : 12 → option (b)
Why the others are wrong
- (a)11 : 12 — 11 : 12 is 55 : 60 — the 2015 bar read correctly but the 2018 bar dropped to 55. The 2018 bar clearly rises above the 60 gridline, not below it.
- (c)12 : 11 — 12 : 11 puts 2015 first and also misreads 2018 as 55. The question asks for 2018 to 2015, so the later year has to lead.
- (d)13 : 11 — 13 : 11 keeps 65 for 2018 but reads 2015 as 55. The 2015 bar meets the 60 gridline exactly, and 65 : 60 reduces by 5 to give 12, not 11.
Concept
Bar-graph data interpretation in Tier-I is a reading test with a single arithmetic step attached.
Values that do not land on a gridline have to be interpolated, and nothing finer than half an interval is ever intended: a bar halfway between the 60 and 70 lines reads 65.
Once the two values are read, the rest is ordinary reduction. Here 65 : 60 share a factor of 5, giving 13 : 12.
Each of the three wrong options comes either from reading one bar 5 million dollars low or from reversing the order, so the item is decided at the graph, not in the arithmetic.
Key facts
- The 2015 bar reads 60 million dollars and the 2018 bar reads 65 million dollars.
- 65 : 60 reduces to 13 : 12 once both terms are divided by 5.
- A ratio of A to B keeps A as the first term, so 2018 leads and 2015 follows.
Study next
Common traps
- Reversing the order and answering 12 : 13 when the question says 2018 to 2015
- Reading the 2018 bar as 60 because it is near the gridline rather than midway to 70
- Trying to reduce 65 : 60 by 10 and producing a ratio that is not in whole numbers
The same read-then-compute skill is tested on income tables at Quant Q.1 and Q.2 of this shift, and on a pie chart of a student's day at Quant Q.9.
The chart type changes from item to item, the two-step shape does not.
Related PYQs
No directly related past PYQ was found.