
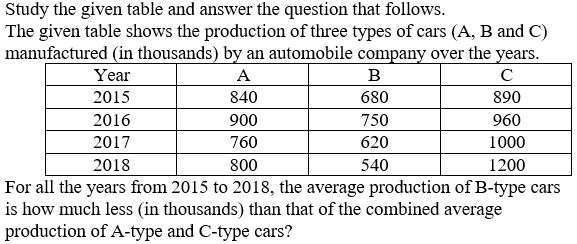
Study the given table and answer the question that follows. The given table shows the production of three types of cars (A, B and C) manufactured (in thousands) by an automobile company over the years. Year → A | B | C 2015 — 840 | 680 | 890 2016 — 900 | 750 | 960 2017 — 760 | 620 | 1000 2018 — 800 | 540 | 1200 For all the years from 2015 to 2018, the average production of B-type cars is how much less (in thousands) than that of the combined average production of A-type and C-type cars?
- (a)271.25
- (b)284.55
- (c)238.5
- (d)314.75
Answer
Why
Correct — A. Average B on its own, then average A and C together across all eight entries.
B total = 680 + 750 + 620 + 540 = 2,590
B average = 2,590 ÷ 4 = 647.5
A total = 840 + 900 + 760 + 800 = 3,300
C total = 890 + 960 + 1,000 + 1,200 = 4,050
A and C combined = 7,350 over 4 years × 2 types = 8 entries
Combined average = 7,350 ÷ 8 = 918.75
Difference = 918.75 − 647.5 = 271.25 → option (a).
Why the others are wrong
- (b)284.55 — Every difference available here is a multiple of 0.125. B divides by 4 and the eight A and C cells divide by 8, so a .55 ending cannot arise — 284.55 would need an A and C total of 7,456.4.
- (c)238.5 — 238.5 undershoots. It needs the combined A and C average to be 886, an eight-cell total of 7,088. The table's A and C cells add to 7,350, giving 918.75.
- (d)314.75 — 314.75 overshoots. It needs the combined average to be 962.25, an eight-cell total of 7,698 — nearly 350 above the 7,350 the table actually holds.
Concept
The phrase that decides this item is combined average. Combining A and C means one average over all eight numbers, not the average of two separate averages.
Averaging averages is safe only when the groups are the same size. Here they are: A averages 825 and C averages 1,012.5, and their midpoint 918.75 equals the eight-cell average exactly because both counts are 4.
Give one type a fifth year and the two routes stop agreeing — the eight-cell route stays right, the midpoint route does not.
Production is given in thousands and the answer is asked for in thousands, so nothing needs converting.
The table runs 2015 to 2018, which is all four of its rows, so 'for all the years' takes every cell rather than a subset.
Key facts
- A combined average is the sum of both groups divided by the total count, not the mean of the two group averages.
- The two routes agree only when the groups hold equal numbers of entries, as A and C do with four years each.
- Over 2015-2018 the table gives B an average of 647.5 thousand and A and C a combined average of 918.75 thousand.
- A averages 825 thousand and C averages 1,012.5 thousand over the same four years.
Study next
Common traps
- Averaging 825 and 1,012.5 out of habit, which happens to work here only because both counts are four.
- Dividing the A and C total by 4 instead of 8, which gives 1,837.5.
- Answering with the combined average itself rather than with its distance above B.
Difference-of-averages off a production table is set again at 23 Sep 2024, 09:00, Quant Q.22 and at 25 Sep 2024, 16:00, Quant Q.9.
The same table shape is read for a maximum average instead of a difference at 9 Sep 2024, 16:00, Quant Q.11, so learn to spot which statistic the last line asks for before you total anything.
Related PYQs
No directly related past PYQ was found.