
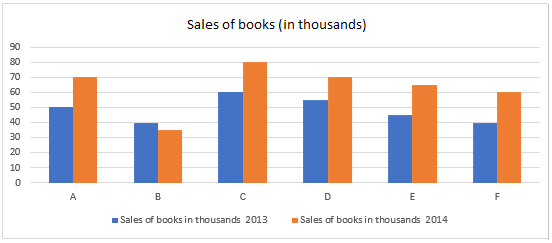
The bar graph given below shows the sales of books from six schools during two consecutive years, 2013 and 2014. What percentage of the average sales of the schools A, B, and C in 2014 is the average sales of schools A, C, and F in 2013?
- (a)81.08%
- (b)81%
- (c)80%
- (d)80.08%
Answer
Why
Correct — A. Read the bars in thousands, blue for 2013 and orange for 2014.
2014 for A, B, C: 70 + 35 + 80 = 185, so the average is 185⁄3.
2013 for A, C, F: 50 + 60 + 40 = 150, so the average is 150⁄3 = 50.
The wording asks what percentage the 2013 average is of the 2014 average, so 2014 is the base:
(150⁄3) ÷ (185⁄3) × 100
The 3s cancel, leaving 150⁄185 × 100 = 30⁄37 × 100.
30⁄37 = 0.810810… → 81.08% → option (a).
Why the others are wrong
- (b)81% — 81% is 30⁄37 cut off rather than rounded. The value is 0.810810…, and because the paper offers a two-decimal option the rounding is part of the answer.
- (c)80% — 80% would need the 2014 total to be 187.5 instead of 185, since 150 ÷ 187.5 = 0.80. No reading of bars A, B and C produces 187.5.
- (d)80.08% — 80.08% carries the right decimals onto the wrong whole number. 150 ÷ 185 = 0.8108…, so the integer part is 81.
Concept
"What percentage of X is Y" fixes the denominator: X is the base. Here X is the 2014 average for A, B and C, and Y is the 2013 average for A, C and F, so the fraction is Y ÷ X.
Both averages divide by 3, so the 3s cancel and you can work straight from the totals — 150 over 185. That cancellation is the whole shortcut, and it holds whenever the two groups being compared contain the same number of items.
The graph is labelled in thousands, but since the answer is a ratio the unit drops out entirely. Read every bar against a gridline before computing — one misread bar moves the answer by whole percentage points.
Key facts
- In "what percentage of A is B", A is the base and the fraction is B ÷ A.
- Averages over groups of equal size cancel, so (150⁄3) ÷ (185⁄3) reduces to 150⁄185.
- 150⁄185 reduces to 30⁄37, which is 0.810810… or 81.08% to two decimal places.
- From the bars: A is 50 in 2013 and 70 in 2014, C is 60 and 80, F is 40 and 60, B is 40 and 35.
Study next
Common traps
- Inverting the base and computing 185⁄150 = 123.33%.
- Averaging the wrong three schools, since 2014 uses A, B, C while 2013 uses A, C, F.
- Rounding to 81% when the option list separates the whole number from the two-decimal value.
SSC pairs a bar graph with an average or a ratio drawn from two differently chosen groups, so the reading stays easy and the grouping is the real test.
See 9 Sep 2024, 12:30, Quant Q.20, which asks for a ratio across two institutes and three chosen years, and 13 Sep 2024, 09:00, Quant Q.16, which asks for a difference between two averages.
Related PYQs
No directly related past PYQ was found.