What & Where
Foreign Direct Investment (FDI): ≥10 % equity stake by a non-resident, conferring control/management rights.
Routes & Forms: Automatic vs Government approval; equity infusion, reinvested earnings, intra-company loans.
Core Sources FY 24-25: Singapore (~15 %), Mauritius (~10 %), reflecting financial-centre dominance.
Quick Facts for MCQs
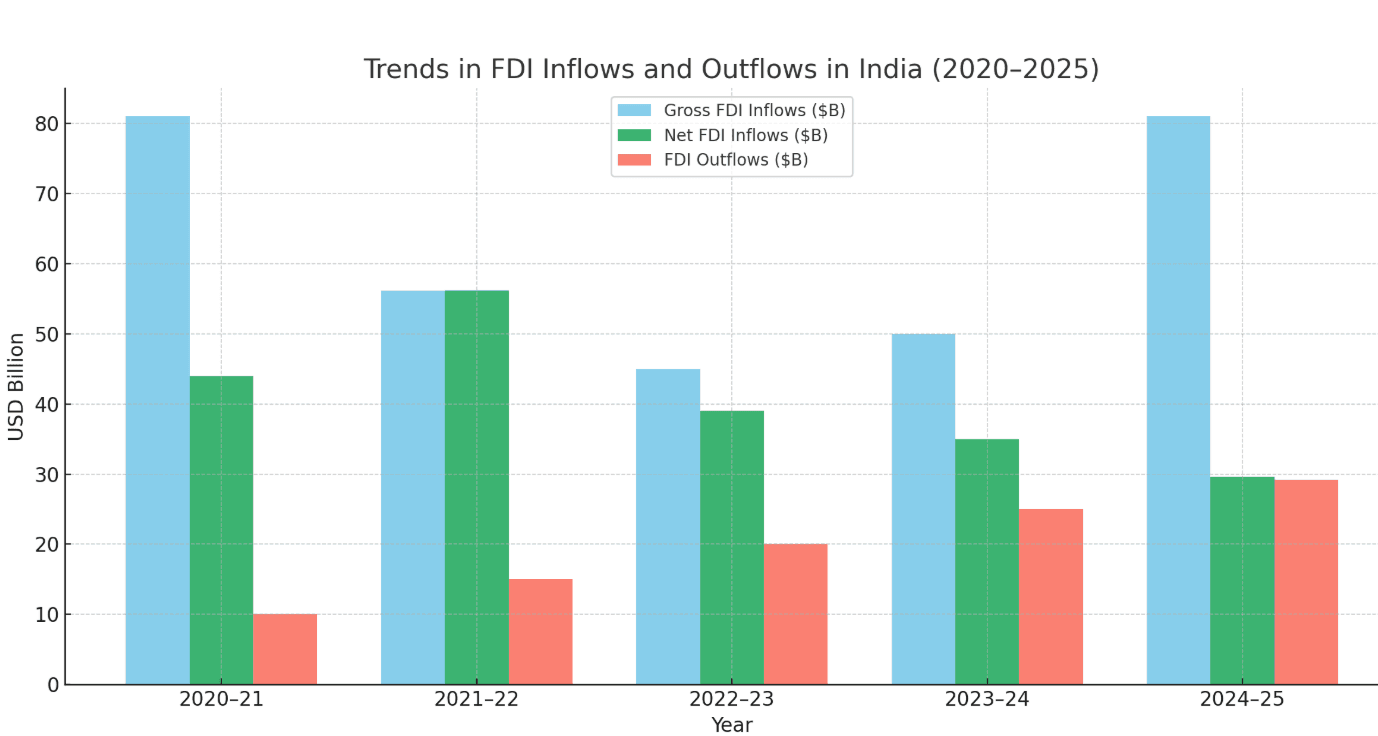
Trends & Numbers
- Net-FDI collapsed: USD 44 bn (2020-21) ➜ USD 0.4 bn (2024-25).
- Disinvestments ballooned: <1 % early-2000s ➜ 63.5 % of gross inflow now.
- Outward-FDI surged to USD 29.2 bn, nearly tripling within five years.
Structural Issues
- Concentration: Singapore & Mauritius flows suggest round-tripping, low real-sector linkage.
- Sectoral slide: Manufacturing share just 12 %; computer services see withdrawals.
- Data mismatch: UNCTAD figures 60 % below RBI, hinting possible overstatement.
Policy Toolkit
- Stability: Transparent, predictable FDI regime to retain long-term investors.
- Quality push: Prioritise manufacturing, green tech, R&D via targeted incentives.
- Treaty rationalisation: Curb tax-haven routing; institute sector-wise outcome monitoring.
Key Data Points
| Feature | Data-Point |
|---|---|
| Gross FDI inflow growth FY 24-25 | 13.7 % |
| Net FDI FY 24-25 | USD 0.4 bn |
| Net FDI FY 20-21 (peak) | USD 44 bn |
| Avg gross inflow growth, last 4 yrs | 0.3 % p.a. |
| Repatriation growth post-pandemic | 18.9 % p.a. |
| Disinvestments share in gross FDI | 63.5 % |
| Manufacturing FDI share FY 24-25 | 12 % |
| Outward FDI FY 24-25 | USD 29.2 bn |
| Outward FDI rise in 5 yrs | ~3× |
| UNCTAD vs RBI FDI gap | up to 60 % lower |
Related UPSC Prelims PYQs
ESE_GS, GS1 2020PYQ 1
With reference to Foreign Direct Investment in India, which one of the following is considered its major characteristic?
ESE_GS, GS1 2026PYQ 2
According to the Reserve Bank of India’s report, which two countries together accounted for over one-third of the total FDI in India?